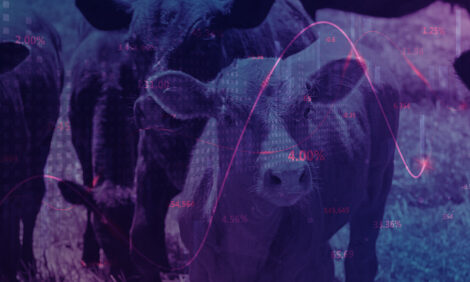
Economic Benefit Of Genomic Selection For RFI
The aim of the Australian Profit Ranking (APR) selection index for Australian dairy cattle is to improve the profitability of dairy farming. It assigns weights to milk, fat and protein yield, daughter survival, daughter fertility, somatic cell count, live weight, temperament and likeability according to their contributions to profit and their correlations, write B Hayes, J Pryce from the Department of Primary Industries, Australia and J Van Der Werf, University of New England. 28 August 2011
 13 minute read
Summary
Although the index partially captures gross efficiency, it does not account for variation in efficiency with production level or for metabolic efficiency. Incorporation of residual feed intake (RFI) in the APR would enable selection for metabolic efficiency, which may contribute substantially to profit, given that cost of feed accounts for 50 per cent of all costs associated with dairy production systems.
Whereas the cost of routine measurement of RFI would be prohibitive, predictions of RFI breeding value from DNA markers could be used. An accuracy of 0.42 for a DNA marker-derived RFI breeding value was recently reported. In this report, we discuss an appropriate weight for RFI for inclusion in the APR, given the genetic variation in this trait and its correlations with other traits in the APR.
We demonstrate that selection for an APR that includes DNA marker-derived breeding values for RFI would improve the annual rate of gain in profitability by 3.8 per cent. On an industry wide basis, this is equivalent to $515,092 in additional profit per year.
Introduction
The aim of the Australian Profit Ranking (APR) selection index for Australian dairy cattle is to improve the profitability of dairy farming through selection of bulls and heifers.
The APR weights milk, fat and protein yield, daughter survival, daughter fertility, somatic cell count, live weight, temperament and likeability according to their contributions to profit and correlations among the traits (e.g., Pryce et al., 2009). Given that the cost of feed accounts for between 43–67 per cent of the total farming expenses in a dairy production system (Ho et al., 2005), a key component of this index is efficiency.
The APR captures some of the variation in gross efficiency, as it includes body weight with an economic weight based on the energetic requirements for maintenance and production (Pryce et al., 2009). However, gross efficiency estimated in this way does not enable comparison between cattle at different levels of production and does not distinguish between energy used for production, maintenance, lactation or tissue metabolism, which may differ in efficiency (Veerkamp et al., 1995).
Residual feed intake (RFI) as described by Koch et al. (1963) is a measure of feed efficiency that is independent of an animal’s body size and production level and takes into account variation in maintenance efficiency. RFI can be defined as the difference between an animal’s actual feed intake and its expected feed intake based on its production, size and growth (Veerkamp et al., 1995; Archer et al., 1999).
A recent study demonstrated substantial variation in RFI among growing heifers; in a trial in which the intakes of 903 Holstein-Friesian 6-month-old heifers were individually monitored, the feed intakes of heifers with the lowest and highest 10 per cent of RFIs differed by 1.5 kg/day. The phenotypic standard deviation was 0.19 kg/day and the heritability of RFI was estimated to be 0.27. Variation in RFI is much larger in lactating cows than in heifers. Meta-analysis of published values of RFI measured in lactating cows (Korver et al., 1991; van Arendonk et al., 1991; Ngwerume and Mao, 1992; Svendsen et al., 1993; Veerkamp et al., 1995) resulted in an estimated phenotypic SD of RFI of 9.4 MJ ME/ day, equivalent to 0.9 kg DM/day. The mean heritability estimate for RFI in lactating Holstein-Friesian cows is 0.1 (van Arendonk et al., 1991; Ngwerume and Mao, 1992).
The reported genetic variation in RFI and the substantial contribution of the cost of feed to total costs suggest that selection to improve this trait could have an economic impact on the profitability of dairy farming. However, the requirement for data on individual feed intake, measurement of which is very costly, is a barrier to selection for RFI.
An alternative would be to use genome-wide DNA markers to capture genetic variation in RFI, and to use such data to estimate breeding values for selection (genomic selection; Meuwissen et al., 2001). Genomic selection has been implemented in dairy breeding programs in many countries for herd recording traits (e.g., production, survival, fertility; see VanRaden et al., 2009 and Hayes et al., 2009 for reviews) but not for traits that are not routinely recorded.
The amount of genetic gain that can be made in RFI using genomic selection will be directly proportional to the accuracy of the genomic estimated breeding values, where accuracy is the correlation between the genomic estimated breeding values and the true breeding values for the selection candidates. In a recent experiment, a panel of genetic markers was discovered that was used to predict genomic estimated breeding values for RFI in Holstein-Friesian cattle with a moderate degree of accuracy (0.41 ± 0.02) (Pryce et al., 2011). Thus, the industry could now make use of genomic selection of bulls and heifers for RFI. However, selection for RFI alone would not maximise profit; the best use of RFI would be to incorporate it as an additional trait in an APR in which all traits that contribute to profit are appropriately weighted and profit is maximized.
In this manuscript, we included RFIs of growing heifers and lactating cows in a multiple-trait selection index that included the APR to derive an appropriate economic weight for this trait. We then predicted the extra profit that would accrue to the Australian dairy industry if RFI were to be included in the selection index.
Materials and Methods
Genetic correlations between APR traits and RFI In order to understand the implications of including RFI in a selection objective and to identify possible unfavourable correlated responses of selecting for RFI, accurate estimates of genetic correlations between RFI and other traits in the selection index are required.
As the heifers used to estimate genetic parameters for RFI in the trial of Williams et al. (2011) are currently part way through lactation, there is insufficient data to estimate the genetic correlations directly using data collected from the heifers for both RFI and other traits in the APR. As an approximation, we used sire breeding values for the APR traits to approximate genetic correlations with RFI, following the approach described by Royal et al. (2002).
Genetic correlations between RFI and other traits in the APR were estimated using genetic regressions of sire ABVs. Of the 168 sires of heifers in the heifer feed conversion efficiency experiment of Williams et al. (2011), 157 had ABVs available from the Australian Dairy Herd Improvement Scheme database for milk, milk fat and milk protein yields and percentages, fertility (expressed as the 6-week-in-calf rate), live weight, overall type and survival. An indication of the genetic correlation estimates between other traits can be obtained from genetic regressions of RFI on these traits.
Derivation of index weights
Multiple trait selection index theory was used to calculate the potential benefit of including DNA information for RFI in selection decisions. A multi-trait selection index for APR similar to that described by Pryce et al. (2009) was constructed with RFI as an additional trait. Genetic correlations between RFI and the APR traits were the inferred genetic correlations transformed from genetic regressions, obtained as described above.
The method to include a genomic breeding value in a selection index has previously been described by Van Eenennaam et al. (2011). This method assumes that a genomic estimated breeding value (GEBV) is available, either independently or in addition to daughter records. We assumed that RFI was only available as a GEBV, i.e., that no daughter records were available and that the accuracy of prediction was 0.4 (Pryce et al., 2011).
The other APR traits were assumed to be estimated breeding value (EBVs) estimated with either 70 daughters (for production traits and somatic cell count (SCC) or 30 daughters for non-production traits. Based on recent work by the Australian Dairy Herd Improvement Scheme (www.adhis.com.au) the reliability of the genomic breeding values for production traits (excluding daughter records) were assumed to be 0.5, and that of SCC was assumed to be 0.4. Non-production traits (excluding RFI and SCC) were assumed to have reliabilities of 0.3.
As the Australian Profit Ranking (APR) is expressed on an annual basis, the phenotypic SD of RFI (0.44 kg/d) was annualised by multiplying it by 365 to give 159.1 kg/year. The economic value of feed was the same as the opportunity cost of feed used in the APR model (Pryce et al., 2009), i.e., $0.019/MJ ME. As feed was expressed in kg rather than MJ of ME, it was assumed that the average ME content of dairy feed was 10.5 MJ ME per kg. Therefore, the economic value of an extra kg of feed in the multi-trait model was $0.20/kg.
Sensitivity analysis
The genetic correlation between RFI and fertility was 0.11 according to the genetic regression method (see results). There is a chance that this genetic correlation is an underestimate. The only way of knowing whether it is an underestimate is to re-estimate the genetic correlation when data becomes available. To investigate the consequences of a very high genetic correlation between RFI and fertility, we also ran a scenario in which the genetic correlation between these two traits was 0.3.
The phenotypic SD of RFI in growing heifers was assumed to be 0.44 kg/d. As the feed intake capacity of 6-month-old heifers is lower than that of lactating cows, the estimate of response to selection may only be relevant to heifers. An alternative way to determine the phenotypic standard deviation of RFI is through a meta-analysis of published values of RFI measured in lactating cows (Korver et al., 1991; Ngwerume and Mao, 1992; Svendsen et al., 1993; van Arendonk et al., 1991; Veerkamp et al., 1995). The phenotypic SD for RFI obtained from the meta-analysis of RFI was 9.4 MJ ME/day, which is equivalent to 0.9 kg DM/d (326.8 kg/ year). This alternative estimate of the SDp of RFI was also used in our calculations.
Results and Discussion
The genetic correlations between APR and RFI indicate that selection for RFI will result in an increase in protein, fat and milk yield, overall type, survival and live weight (Table 1).
Table 1. Correlations between Australian Breeding Values (ABVs) of sires and sire solutions for residual feed intake (RFI) (r(abv,sire_sln), genetic regression coefficients (b) of RFI on sire ABVs for production, fertility, live weight, overall type and survival and corresponding genetic correlations (ra) between RFI and Australian Profit Ranking (APR) traits.
Table 1. Correlations between Australian Breeding Values (ABVs) of sires and sire solutions for residual feed intake (RFI) (r(abv,sire_sln), genetic regression coefficients (b) of RFI on sire ABVs for production, fertility, live weight, overall type and survival and corresponding genetic correlations (ra) between RFI and Australian Profit Ranking (APR) traits.
| Trait | r(abv, sire_sln) | B | error | P | ra |
|---|---|---|---|---|---|
| Milk protein (kg) | –0.077 | 0.000 | 0.001 | 0.926 | 0.007 |
| Milk fat (kg) | –0.122 | 0.000 | 0.001 | 0.903 | –0.010 |
| Milk volume (kg) | –0.077 | 0.000 | 0.000 | 0.874 | –0.012 |
| Protein (%) | 0.019 | 0.057 | 0.125 | 0.651 | –0.040 |
| Fat (%) | -0.027 | 0.000 | 0.061 | 0.994 | –0.001 |
| APR ($) | –0.134 | 0.000 | 0.000 | 0.891 | –0.011 |
| Overall type (%) | –0.093 | 0.005 | 0.004 | 0.174 | –0.107 |
| Fertility (%) | 0.137 | 0.008 | 0.006 | 0.189 | 0.101 |
| Survival (%) | –0.108 | -0.004 | 0.007 | 0.582 | -0.043 |
| Live weight (kg) | –0.048 | -0.001 | 0.006 | 0.859 | 0.014 |
However, these correlations were not significantly different from zero, reflecting the small sample size. The correlation between RFI and fertility was 0.10, but was also non-significant (P = 0.19). Therefore, there may be a tendency for selection for RFI to decrease fertility, but our dataset does not support this claim conclusively. Given the importance of fertility to the Australian dairy industry, more data is required to understand the genetic relationship between RFI and fertility; this is the subject of current research. Furthermore, genetic correlations estimated using regression coefficients tend to be sensitive to the genetic variances assumed and can be biased by dominating sires (the most frequently represented sire had 43 daughters in the dataset). Due to the potential bias, the results presented herein should be treated with a degree of caution.
The effects of including RFI in the APR on responses to selection are shown in Table 2, assuming the genetic correlations presented in Table 1. When RFI was included in the APR, feed intake was reduced by 0.43 kg/year; if the variation in RFI in cows were much larger (0.9 kg/d), then RFI would decrease by 1.61 kg/ year (Table 2). Converting the latter feed intake value to dollar values using the economic weights of Pryce et al. (2009), this is worth $0.48 per cow per year, which is equivalent to 3.8 per cent of the economic response in protein yield (the trait with the highest economic weight in APR).
Table 2. Responses to inclusion of residual feed intake (RFI) in the Australian Profit Ranking (APR) in growing heifers and lactating cows.
| Trait | APR | APR + RFI heifer | APR + RFI cow |
|---|---|---|---|
| Milk yield (L) | 57.60 | 57.55 | 57.24 |
| Protein (kg) | 2.12 | 2.12 | 2.11 |
| Fat (kg) | 2.50 | 2.50 | 2.48 |
| Survival | 0.88 | 0.88 | 0.88 |
| Fertility (%) | 0.15 | 0.14 | 0.13 |
| SCC (log) | –2.12 | –2.12 | –2.11 |
| Live weight (kg) | 0.66 | 0.65 | 0.65 |
| Milking speed (1–9) | –0.13 | –0.13 | –0.13 |
| Temperament (1–9) | –0.30 | –0.30 | –0.30 |
| RFI heifer(kg/year) | 0.12 | –0.43 | –0.25 |
| RFI cow (kg/year) | 0.55 | –0.65 | –1.61/td> |
If the accuracy of the genomic estimated breeding value for RFI in lactating cows was 0.3 rather than 0.4, then the response to selection in RFI would be reduced to –0.71 kg/year (Table 3).
Table 3. Response to selection using an Australian Profit Ranking (APR) in which Resdiaul feed intake (RFI) is included in cows when RFI is assumed to have accuracy of 0.3 or a correlation of 0.3 with fertility.
| Trait | Low RFI accuracy (0.3) | High RFI correlation with fertility (0.3) |
|---|---|---|
| Milk yield (L) | 57.46 | 57.54 |
| Protein (kg) | 2.12 | 2.12 |
| Fat (kg) | 2.49 | 2.50 |
| Survival | 0.88 | 0.88 |
| Fertility (%) | 0.14 | 0.10 |
| SCC (log) | –2.12 | –2.12 |
| Live weight (kg) | 0.65 | 0.66 |
| Milking speed (1–9) | –0.13 | –0.13 |
| Temperament (1–9) | –0.30 | –0.30 |
| RFI heifer(kg/year) | –0.10 | –0.13 |
| RFI cow (kg/year) | –0.71 | –1.07 |
Given the importance of maintaining and improving fertility in the Australian dairy industry, the sensitivity of response to the correlation between RFI and fertility was also investigated. If the genetic correlation between RFI and fertility was 0.3 rather than 0.1, the response to selection in RFI would be –1.07 kg/year, a reduction in response of 44 per cent. At the same time, the response to selection in fertility would also be reduced by 26 per cent. A key aim of current research is to estimate the genetic correlation between these traits with more precision.
The selection responses in Table 1 can also be expressed in dollars accumulated across the traits. The response to the APR in its current form is $18.67 per cow per year. If the RFI for lactating cows is included in the APR, the response is $19.15 per cow per year. This can be expressed on an industry basis by multiplying by the number of cows in the national herd, approximately 1.8 million. Then, the total industry benefit of including RFI for lactating cows in the index would be $515,092 per year.
The accuracy of genomic estimated breeding values for RFI in our study was assumed to be 0.42, the value reported by Pryce et al. (2011). If this value were to increase, both the response to selection for RFI and the total profit would increase if RFI was included in the APR. The accuracy of 0.42 was obtained as a result of measuring RFI in approximately 2000 growing heifers, genotyping the same heifers for 630,000 DNA markers, and deriving a prediction equation for genomic estimated breeding values based on these markers.
The accuracy of genomic estimated breeding values can be increased by increasing the size of the reference population from which genomic predictions are derived (e.g., VanRaden et al., 2009). Daetwyler et al. (2008) and Goddard (2008) made deterministic predictions of the increase in the accuracy of genomic estimated breeding values as a result of increasing the size of the reference population from which the prediction equation was derived. These predictions suggest that if an additional 2000 heifers were used for RFI measurement, the accuracy of the genomic estimated breeding value would increase to 0.5, increasing selection response by 20 per cent.
Finally, another motivation for selection for RFI concerns methane emission per litre of milk. As methane emissions are highly correlated with dry matter intake, exploitation of the variation in RFI reported by Williams et al. (2011) could reduce methane emission by 14 g/day, a 5 per cent reduction in methane emission per litre of milk.