

MAF New Zealand Dairy Outlook
US dollar prices for dairy products have been at high levels over the course of the 2010/11 dairy season, well above the previous year but still below the levels reached in 2007/08. The strong demand driving this rise is likely to remain but additional supply in 2012 and beyond is expected to drive international prices down from current levels.The outlook for New Zealand’s dairy sector is positive, a prospect based on high international dairy prices driven by strong global demand, especially from developing countries. Butter prices, in particular, have increased more rapidly than other dairy product prices. International dairy prices are expected to remain at a higher level through the outlook period.
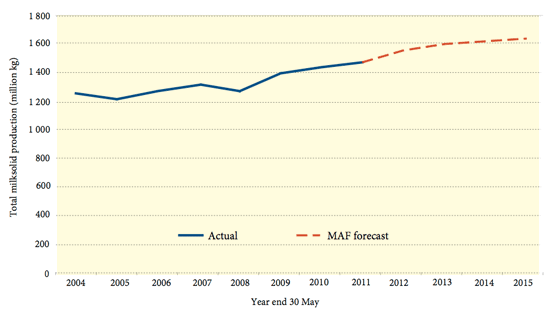
MAF estimates that milk solid production will increase by 2.4 per cent for the year ending 30 May 2011, 5.7 per cent for the 2011/12 season and 2.9 and 1.2 per cent for the following years.
Dairy export revenue for the year ending 30 June 2011 is estimated to be $13.0 billion. Increased milk solid production, along with high dairy prices, is forecast to increase export revenue for the year ending 30 June 2012 to $14.6 billion, or 12 per cent. Further out, export revenue is forecast to increase by another 6.9 per cent for the year ending 30 June 2013, with more gradual increases thereafter.
FIGURE 15.1: MAF FORECAST FOR TOTAL MILK SOLID PRODUCTION
SONZAF 2010 Outlook Updated
In last year’s report, MAF forecast milk production to increase by 14 per cent for the 2010/11 season. Another 2.9 and 2.1 per cent increase in milk production was forecast for the 2011/12 and 2012/13 seasons respectively. These forecasts were based on three key assumptions: the increase in the number of cows and heifers in milk; the increase in the milk solids per cow produced; and weather conditions to return to the 30-year average. As it turned out, however, actual cow numbers increased less than was expected and dry weather in spring and early summer meant there was little increase in milk solids per cow. Actual variability relative to the assumptions used in forecasting meant that the increase in milk solids production forecast was not realized.
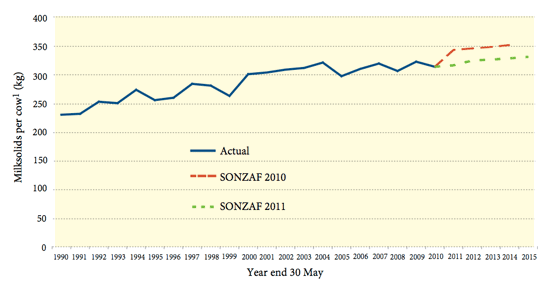
MAF has improved the method used to estimate potential milk solids per cow since last year’s report. This improvement resulted in a downward revision of estimated total milk solids forecast. The new method accounts for additional factors such as nitrogen application and stocking rates, causing the potential milk solids per cow to be lower in the absence of weather shocks. Figure 15.2 shows a comparison between previous projections of milk solids per cow and current projections.
FIGURE 15.2: MILK SOLIDS PER COW ASSUMPTIONS, ACTUAL AND FORECAST
Sources DairyNZ, Statistics New Zealand and MAF.
Why Forecasts Can Vary
Forecasting is always subject to variability. Three key components are primary contributors to the variability inherent in MAF’s SONZAF forecasts.
Method
To forecast milk solid production MAF employs an econometric model using information such as dairy animal numbers from the Agricultural Production Survey, future farm gate milk prices derived from international dairy prices, and past weather patterns. The model compares the relative profitability of the dairy sector, sheep and beef sector and forestry. The relative profitability between these sectors then determines how land moves from less profitable sectors to more profitable sectors. The projections are then used to forecast total milk solids produced.
Price
The New Zealand farm gate milk price is interlinked with international dairy prices. Any variation to the exchange rate assumptions add to the variability of the forecasts.
Weather
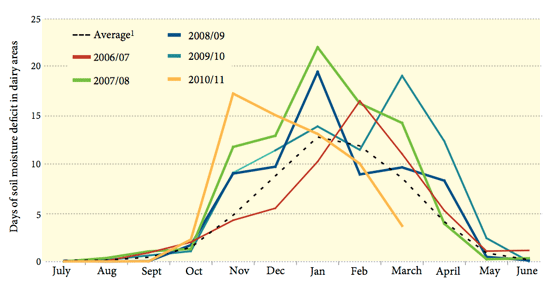
Weather plays another critical part in the forecasts. Total milk solids produced in a season are very sensitive to weather changes since the New Zealand dairy system relies on pasture grown throughout the production season, unlike the US and the EU, which mostly use grain-fed systems. Over the last few dairy seasons, the weather in New Zealand has deviated substantially from the 30-year average, thereby increasing the variability between forecast and actual production. Figure 15.3 shows the number of days of soil moisture deficit in dairy producing regions for the last five dairy seasons compared with the 30- year average.
In the absence of information on future weather or any other weather shocks, MAF assumes weather patterns to return to the 30-year average over the outlook period. This is referred to as an average weather season.
FIGURE 15.3: DAYS OF SOIL MOISTURE DEFICIT IN DAIRY AREAS
Sources National Institute of Water and Atmospheric Research (NIWA) and MAF.
Prices
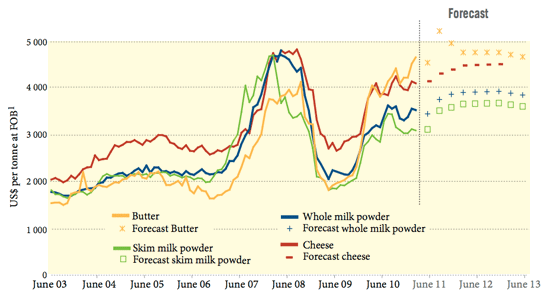
International dairy prices have been increasing since the middle of 2009 but have not yet reached the highs of 2008, with butter being the exception. Since mid-2010, butter prices have increased faster than all other dairy product prices (see figure 15.4). Most other commodity prices have also increased rapidly in recent months, fuelled by strong demand.
The outlook for dairy demand in 2011 is robust, based on both rising incomes and population growth in developing countries. Dairy products, especially milk powders, are in strong demand in developing countries like China, underpinning high international dairy prices. Increasing world oil prices should also support strong demand, and thus high international prices, for dairy products from oil-exporting countries, like Venezuela, United Arab Emirates and Saudi Arabia. These countries are already important dairy export markets for New Zealand.
An assumed return to average weather and high international prices is expected to encourage higher milk production in the major producing and exporting economies, such as the EU, US and Australia, lifting world dairy production beyond 2011. Producers in the US are already responding to high dairy prices by increasing exports and production, despite high corn prices. High corn prices are expected to moderate production growth in countries that mainly use feed-based systems but the additional product available should ease some of the pressure on international prices over the medium term.
FIGURE 15.4: DAIRY ExpORT pRICES AND MAF pRICE FORECAST IN US DOLLAR TERMS
Sources Statistics New Zealand and MAF.
The milk price for the 2010/11 season is estimated at $7.50 per kilogram of milk solids, 9 cents short of the historic high of three seasons ago. International dairy prices improved as the season progressed, lifting the milk solid price. MAF forecasts the milk price for the year ending 31 May 2012 at $6.87 per kilogram of milk solids. This price reflects the assumption of softening international dairy prices as world supply starts to respond to increasing world demand. Beyond 2012, the assumption of a depreciating New Zealand dollar drives most of the lift in the milk price, which is projected to be $8.64 per kilogram of milk solids by the year ending 31 May 2015.
Butter
International butter prices in 2010, in US dollar terms, were almost double those of 2009. A combination of factors contributed to the significant increase in butter prices. Indian and Russian demand for butter imports increased as a result of disruptions to local supply. Another factor pushing up butter prices is that less butter was available for international trade, with butter stock levels in the EU and US falling during 2010. At the end of 2010, butter stock levels were 30 per cent lower than a year earlier. Although some of the increase in international butter prices can be explained in terms of supply shocks and lower butter stocks, biofuel policies have also been putting pressure on oil and fat-related products such as oilseeds, which has driven up international prices for these products. These pressures are not expected to abate in the near future. New Zealand is the dominant butter exporter in the world, exporting about 45 per cent of all butter traded, followed by the EU, which exports 20 per cent of the world butter trade. About 24 per cent of butter traded goes to Russia, the single biggest import market for butter. India and Pakistan are big consumers of butter. India alone accounts for about 40 per cent of world butter consumption. Although these countries are mostly self-sufficient at present, any shortages in domestic production will put extra pressure on traded butter and therefore on world prices. In 2009, India imported about 22 716 tonnes of butter, in contrast to an average of 3500 tonnes for the three years prior.
Exports
Export revenue earned from dairy products is expected to reach a new high of $13 billion for the year ending 30 June 2011. Over the outlook period, export revenue is projected to increase, mostly owing to the assumption of a much weaker New Zealand dollar but also to growth in domestic milk production.
The focus of New Zealand’s dairy exports shifted in 2010. The volume of whole milk powder exported increased by 16 per cent, while cheese, butter and skim milk powder export volumes fell between 9 and 17 per cent. Whole milk powder exports made up 37 per cent of New Zealand’s dairy export earnings in 2010.
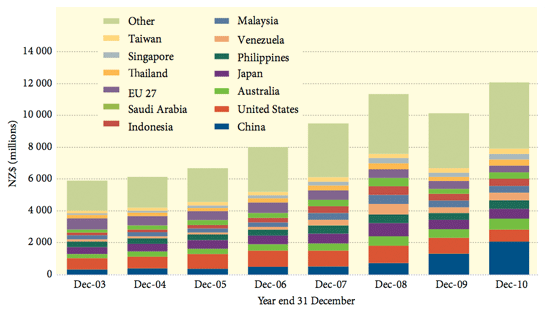
There have been considerable changes in the last few years to the profile of New Zealand’s dairy export markets. In 2008, China became the third biggest export earner for New Zealand dairy products, making up about 6 per cent of total dairy export earnings. The Chinese market has maintained a pattern of steady growth to become the top export earning market in 2010, worth $2.1 billion, or 17 per cent of total dairy export earnings. China is now New Zealand’s single biggest dairy export market. New Zealand exports a variety of dairy products to China such as whole and skim milk powder and anhydrous milk fat.
New Zealand is the world’s largest exporter of whole milk powder, and in 2010 China overtook Algeria and Venezuela as the largest importer. While there has been increased demand for dairy products in China from all sources, including domestically produced products, most of China’s whole milk powder imports came from New Zealand, and 31 per cent of New Zealand’s whole milk powder exports go to China. There are many factors driving the increase in dairy exports to China, including, for example, China’s impressive economic growth, the sheer size of China’s dairy market and its rapid growth, effects of the melamine crisis in 2008 on consumer confidence in domestically produced dairy products, and the China-New Zealand Free Trade Agreement, which came into effect in October 2008. This trend in growing dairy imports into China is expected to continue in the future as domestic demand continues to expand.
FIGURE 15.5: TOTAL DAIRY EXPORT REVENUE BY COUNTRY IN NZ DOLLARS
