Dairy Profitability 101: Milk Quality and Feed Efficiency
In very simple terms, dairy profitability can be defined as the difference between milk prices and the cost of production, multiplied by the pounds of milk produced. Thus, milk prices, the cost of production, and the pounds of milk produced are the three critical components for dairy profitability, writes Alvaro Garcia, DVM, Department of Dairy Science, South Dakota State University. 25 June 2009
 9 minute read

Therefore, it is very important for producers to have a firm grasp on the three components (price, cost, and volume) of this equation and attempt to modify them in their favor. When milk prices are high and input costs low, producers should use all possible means to improve production and increase gross returns. When the milk price/input relationship is not that favorable, the approach is usually to cut costs, but this short-term, saving approach oftentimes affects medium- to long-term cow productivity and the milk, overall, shipped from the farm. It is critical for producers to identify those areas where they can reduce costs without having an impact in the cows both in the short and/or in the long term.
Milk price
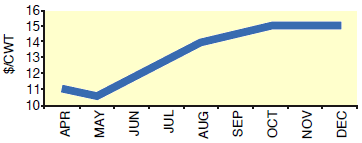
Futures milk prices are only $15 per 100 lbs. (CWT) for December 2009 (fig. 1). As of Feb. 2009, operating costs for the Midwest are estimated to be around $16 per CWT. If input prices remain relatively stable during the rest of the year, the best-case scenario will be a loss of $1 of income over operating costs per CWT for the last 3 months of the year.
Figure 1. Milk price futures (2009)
Where can producers find that extra $1, that extra $1 that can make the difference between surviving the current economic crunch and having to quit the industry altogether? If cutting costs is a dangerous approach, the one other area left for improving profitability is milk quality. Whether any money—and how much of it—can be made depends on the current milk quality of a particular dairy and on the premiums paid by the milk processor.
A reduction in bacteria counts to 25,000 can represent 10 additional cents per CWT, and if the somatic cell count (SCC) drops from 400,000 to 150,000, there are an additional 30 cents to be made. But with that 40 cents accounted for, where will the extra 60 cents needed to break even come from? Basically from two areas: 1) increased milk production (and components) and 2) decreased treatment costs.
“Opportunity milk” can be defined as milk with the potential to be produced but that is left out of the tank because of negating management factors. When bacteria multiply in the mammary gland, the bacteria damage the secretory cells, and thus less milk is produced. It is estimated that each 100,000 increase in SCC represents a daily loss of 0.6 and 1.3 lbs. for primiparous and multiparous cows, respectively. In other words, if SCC drops from 400,000 to 200,000, a dairy can expect a 2-pound increase in production, or additional gross revenues of 30 cents per cow for $15 milk. Recent research suggests that the average annual cost of clinical mastitis is $71 per cow, and the average cost of a clinical mastitis case is $179 (Bar et al. 2008).
The average clinical mastitis cost was broken down as follows: milk yield losses $115, increased mortality $14, and treatment-associated costs $50 (Bar et al. 2008). Considering an average mastitis incidence for the U.S. of 17 per cent, dropping that percentage by approximately two points can result in an average yearly savings of $8 per cow, or 3 additional cents per CWT at 24,000 RHA..
Cost of production
Costs of production are variable and are usually influenced by the size of the operation and how effectively the operation uses its assets. Total costs of production can be divided into operating costs and allocated overhead costs. The operating costs are usually composed of feed, veterinary, bedding, marketing, custom services, energy (fuel, lube, and electricity), repairs, and interest on operating capital.
For Midwest dairy operations, operating costs represent roughly 60 per cent of the total costs of production. The largest component, by far, is feed costs (almost 70 per cent of the total operating costs); feed costs represent 40 to 50 per cent of total production costs (operating plus allocated). Thus, from a producer’s perspective, it is tempting to try to reduce feed costs in order to improve net returns. Reducing feed costs would make economic sense if substituting a feed ingredient or removing an additive does not impact production or breeding in the short or long term. But it is difficult to think of a given feed ingredient in the TMR that was added out of impulse and is not needed to sustain current production.
Almost anything can be removed from a ration without immediate, apparent negative effects. The problem is the deferred effects that might only be evident after a few weeks, months, or even the next lactation. The last thing producers want is to compromise the current or future production, eroding the positive end of the profitability equation—i.e., the total milk shipped. After all, the money used to produce milk after other expenses are paid for (fixed costs) has the best return on investment. If one compares the cow to a “certificate of deposit,” how many banks out there pay 100 per cent in just a few days? Even at a low milk price of $12 per CWT and high feed costs of 12 cents per pound, 1 lb. of feed still results in 2 lbs. of milk, or 12 cents invested and 24 cents received!
If reducing feed quality may have deferred, negative effects on cash flow, trying to save money on other expenses that impact the cow directly can have more drastic consequences. Veterinary expenses, medicines, and hoof trimming usually represent around 8 per cent of operating costs, or $1.20. These costs represent around $1 per cow daily for a Midwest dairy with a RHA of 24,000 lbs. There is very little that can be done here with the exception of preventative medicine. This dovetails with the above discussion about feed quality. Adequate amounts of all nutrients are not only essential for milk production but also are key ingredients for boosting the cow’s immune system. Deficiencies in key nutrients (e.g., specific vitamins and minerals) will reduce disease resistance and leave the cows vulnerable to ailments that otherwise would be effectively fought off.
One area where there is usually temptation to reduce costs is bedding. But the short-term savings can actually be quite costly in the medium-to-long term. Bedding usually represents only 2 per cent of the operating costs, or a total of 25 cents per cow per day. Does it make sense to try to save money in bedding? What are the consequences of reducing bedding? Recent research has shown that when stalls were bedded with sand 2 inches (or 5 cm.) under the curb, cows reduced the time they spent lying by 2 hours per day (Drissler et al. 2005). Conversely, an increase in 2 hours per day of lying time was observed when 17 lbs. of sawdust per stall was added on top of mattresses (Drissler et al. 2005). Another experiment showed that when the bedding was wet, cows reduced the time spent lying by 5 hours per day and increased the time spent perching with just 2 feet in the stall (Fregonesi et al. 2007). Reduced amounts of bedding and/or replacing the bedding less often leads to cows standing for longer periods of time. When cows remain standing, two things happen: 1) their hooves usually spend more time on wet surfaces, absorbing more water and reducing their hardness, and 2) their 4 feet have to bear an added 350 lbs. (roughly) each for 2 or more additional hours per day. The unwanted outcomes of increased standing are hoof lesions and lameness. Lame cows incur higher production losses, lower fertility, and greater culling rates. Deaths due to lameness or injury increased 60 per cent between 1996 and 2007, and lameness continues to be the second highest reason to cull in the U.S., right at 16 per cent (NAHMS 2007).
Milk volume
Profit is ultimately determined by the volume of milk shipped from the farm. Even with optimum input-output prices, profitability is only maximized when enough volume is produced. A dairy that has 100 stalls, 80 of which are occupied by milking cows producing 70 lbs. each, will ship less milk than a similar-sized dairy that produces 60 lbs. per cow but has 100 per cent stall occupancy. The key is not high milk averages—high milk averages can be obtained by getting rid of low-producing cows and leaving stalls empty; the key is milk shipped out of the dairy. It is thus important for the dairy to be full with profitable cows.
The milk-to-feed price ratio is defined as the pounds of a 16 per cent protein TMR that can be purchased with 1 lb. of milk. A value of 3 or greater is considered good (1 lb. of milk buys 3 lbs. of feed). Regrettably, as of April 2009 the milk-to-feed price ratio is close to 1.4; this means that for a cow that eats 50 lbs. of dry matter, almost 36 lbs. of milk is required to pay for her feed costs! Furthermore, if we want feed to be 50 per cent of the cost of production, cows should produce on average a minimum of 72 lbs. of milk per day. Improving milk volume per cow should be the first step in any expansion process, before considering the possibility of adding more stalls. If the current cows cannot be milked to their genetic potential, why would adding cows improve the situation? Considering adding more cows should only occur after the herd’s genetic potential has limited production. The same reasoning applies to adding a new milking parlor; unless the current milking system is outdated, one should only consider a new milking parlor when the current parlor’s use (in hours per day) has been maximized. Adding a new parlor once the current parlor’s use has been maximized allows the costs of the parlor to be distributed over a larger number of animals; thus the costs decrease on a per-head basis.
To achieve highly profitable production per cow, the key is to optimize nutrient utilization. This is a different concept from the old axiom of “maximize feed intake.” There is an optimum feed intake for a certain production level that is defined by the nutrients that are actually digested and absorbed rather than by what is eaten by the cow. This is the concept behind feed efficiency, which in simple terms is pounds of milk produced per pound of feed DM consumed. A cow producing 70 lbs. of milk and eating 50 lbs. of DM will have a feed efficiency of 1.4.
Several factors affect feed efficiency, including days in milk, age or lactation number, pregnancy requirements, body weight gain, diet digestibility, rumen fermentation enhancers, excessive heat or cold stress, feed additives, and the use of growth hormone.
Recent studies suggest that the digestibility of the TMR is the best predictor of feed efficiency (Casper et al. 2003). Taking into consideration that grain is highly digestible, the greatest determinant of the digestibility of the TMR will be the digestibility of the forage fraction. For a cow whose energy balance is in equilibrium (no weight gain or loss) and that is fed the usual forage-to-grain ratio of 50:50, forage digestibility has to be at least 60 per cent to achieve a feed efficiency of 1.4; this fact underlines the importance of harvesting forage at optimum maturity.
Of all the parameters that affect profitability of a dairy operation, both feed and milk quality have, without a doubt, the greatest impacts. Improving milk quality enhances profitability through milk quality premiums, increased cow productivity, and reduced cost of production. Milk quality will also affect feed efficiency indirectly through increased productivity at similar feed intakes. Forage digestibility continues to be among the main parameters of highly profitable dairy production systems
June 2009