Feed-Restriction Programs for Growing Heifers
Over the last 40 years, heifer growing programs have undergone various phases and encountered various issues, writes A. F. Kertz, as part of the proceedings from the University of Florida Dairy Extension 20th Symposium. 22 March 2009
 18 minute read
![]()
Introduction
At one time, heifers were the forgotten animal on a dairy, often banished to the proverbial “back 40” acres. They had access to only poor pasture or poor quality forages.
Then in the 1970s and 1980s, corn silage became popular for feeding to dairy cows, and to heifers. Too often corn silage was available free choice to heifers, which resulted in their fattening even if protein supplementation was adequate and grass or other hay was also available. In a classic study, Jahn and Chandler (1976) showed that with high fiber/low quality forage, there was a practical limit to how much protein could compensate for this low quality/high fiber forage.
Stobo et al. (1966) found that with younger calves, increasing forage level had a double negative effect in that average daily gain (ADG) was decreased as forage level increased from 4 to 61 per cent while gut fill also increased distorting true body growth. As increasing emphasis was placed on growing and harvesting higher quality forages for dairy cows, these forages were often fed to heifers too.
At the same time, increasing emphasis was placed on higher genetic merit for cows. Consequently, intake of heifers increased with genetic merit too. And with higher quality forage, heifers could now get fat when fed virtually forage only diets. Some producers then began to seek and use some poorer quality roughage to reduce dietary energy concentration and to thereby limit energy intake when diets were fed free choice to heifers. That led to others seeking another approach to feeding heifers—limiting their intake, which is the subject of this paper.
Dry Matter Intake and Protein/Energy Relationship
Phenotypic variables in raising heifers are many as Hoffman (2004) listed 17 affecting performance other than nutrition. Nutrition itself is comprised of many variables, among which the largest is dry matter intake. Dry matter intake (DMI) prediction for heifers has been difficult. In the 1989 Nutrient Requirements of Dairy Cattle (NRC), the prediction was based mainly on what the energy requirements were estimated to be, and then back calculating what the DMI would need to be to meet those requirements. This resulted (Figure 1) in a similar curve to the 2001 NRC DMI prediction except when heifers exceeded 450 kg of body weight (BW).
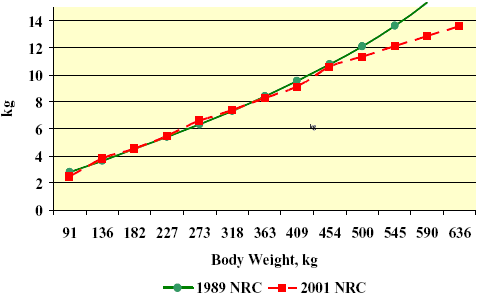
This upswing segment of DMI in the 1989 DMI estimation was based on the assumption that lower quality/energy forages would be used for these larger heifers, which would then require this amount of DMI to meet these heifers’ energy needs. In fact, lower quality forage would reduce DMI because of lower rate and extent of digestibility, which would also increase gut fill. In the 2001 NRC, actual dairy heifer DMI (Figure 2) were gathered (mainly from trials done over a 20 year period at the then Purina Mills Dairy Research Center) and plotted versus DMI prediction using the 1996 Beef NRC equation for beef heifers.
Figure 2. DMI predicted from 1996 Beef NRC versus observed DMI from dairy heifers.
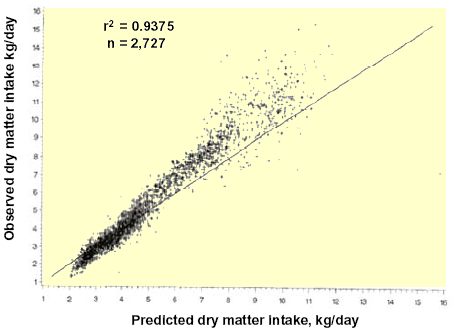
The observed DMI (line) were initially lower than predicted DMI (data points), but then shifted higher and above the line when DMI was 5 kg/d and greater. This inflection corresponds to heifers over 6 months of age. Greater DMI for dairy heifers versus beef heifers above this point may simply reflect the greater size (especially height) of dairy heifers along with their genetic predisposition. Another key point to note is that the spread (variation) of actual DMI progressively increased as heifers ate more. In fact, this DMI variation in heifers is likely greater than in lactating cows. This may be due to greater genetic diversity in heifers, but is more likely due to greater differences in the nature of feeding programs for heifers along with their environmentally different situations.
Dry matter intake of heifers progressively increases as heifers grow larger, but their DMI as a percentage of BW progressively decreases from a high of about 3 per cent around weaning to a low of about 1.8 per cent near calving. Along with this change in relative DMI, there is also a suggested change in the ratio of dietary protein to energy in g of crude protein/Mcal of metabolizable energy/kg of DM (VandeHaar, 1998). For the first 6 months of age, this ratio is recommended to be 66, declines to 63 for months 8 to 12, declines further to 60 for months 12 to 16, bottoms out at 56 for months 14 to 23, and then increases to 60 for months 23 to calving at 24 months of age.
Growth Related Factors
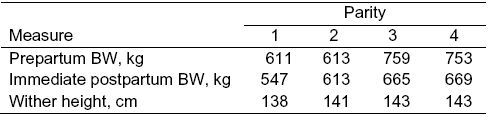
How should growth targets be established? While Mature Body Weights (MBW) have been proposed to establish target weights for growing heifers as a percentage of their MBW (BANM, Hoffman 2007, Van Amburgh and Meyer 2005) this presumes that MBWs are known and that genetic variability is low. In many large commercial herds, genetic history is obscure because in start-up or expansion phases of such herds, bred heifers were purchased with unknown genetic history and from a variety of geographic locations. An example of within breed variation was studied (Hansen et al., 1999) due to divergent genetic selection for large versus small body size of Holstein cows from 1966 to 1994 (Table 1).
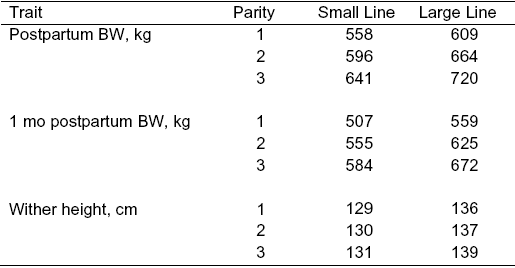
Coefficient of variation (CV) per cent ranged from 0.6 to 1.2 per cent for BW and 0.16 to 0.36 per cent for WH (wither height) for first parity (n = 217) to third parity (n = 51) animals. These results contrast with a 5-year Holstein herd database of mixed genetic lines (Kertz et al. 1997) in Table 2 with a CV of 8 to 9 per cent for BW and 2.3 to 3.1 per cent for WH for first parity (n = 281) to 63 for third or fourth parity (n = 61) animals.
There are several significant limitations of the MBW approach. First is the need for a simple method (Kertz, 2007) to gather BW and WH measurements of either mature cows or by their 2nd lactation to use as a lactation factor to compute MBW. Another very practical problem is grouping and movement of heifers. Bach et al. (2006) evaluated the impact of delaying heifers (n = 2,817 Holsteins) from moving from one group to the next when they had not reached targeted BW for that group. This was done at a large calf/heifer ranch in Spain (disclosure, I have consulted for this operation) which raises for 140 other dairies—hence there is a lot of potential genetic variation. Animals that were delayed, and then regrouped with a new set of younger incoming heifers, were weighed every 15 days until they reached the target BW and then were moved up one group with their initial acquaintances. This resulted in improved daily gain of the older heifers. The overall increased daily gain observed for the first 18 days of regrouping disappeared 45 days later, as the daily gain of delayed animals was then similar to their non-delayed cohorts. Whether this was due to social order, environmental differences, or differences in BW or age is not known.
Lastly, there is a need to grow heifers without fattening. There are some key biological principles to keep in perspective in this regard. First, calves are born with low fat levels, maybe as low as ~4 per cent. Conversely, their body water level is the highest it will likely ever be for there is an inverse relationship between body fat and body water percentages. When animals grow and deposit fat early in life, this is primarily by hyperplasia—that is an increase in the number of adipocytes or fat cells. Later increases in body fat are primarily by an increase in the size of those fat cells-- hypertrophy. The more fat cells that are present at this later stage, the greater the propensity to fatten. That is why there is much concern in the human population with avoiding fatter infants and toddlers. There are too many situations with dairy heifers where they are grown too fast leading to fattening.
What is too fast? An ADG of 0.68 to 0.77 kg during the first two months of a calf’s life results in a doubling of BW by 2 months of age. An ADG of .82 to .91 kg during the subsequent 22 months results in a BW of 636 kg at 22-24 months of age. This is a reasonable pattern of growth for heifers to first calve at 24 mo of age. What about ADG of 1.14 to 1.36 kg? Based on the maximum rate of protein deposition being ~1 kg per day (M. Meyer, Ph.D. thesis, 2007 Cornell University), growth rates greater than that would be fattening. The other element of growth that is often overlooked and seldom measured is height. Total wither height increase from birth to first calving is ~61 cm. One half of that occurs during the first 6 mo of a calf’s life at the rate of 5 cm/mo. Another 25 per cent of that occurs during 7 to 12 mo of life, and then only 25 per cent occurs during the last 12 mo before calving (Kertz et al. 1998). (To convert hip height to wither height simply add 0.8 cm.) Since this height increase is under biological control at given age periods, there is no compensatory gain for height as can occur for BW. An Israeli study (Murkusfeld and Ezra, 1993) concluded that “the relative importance of height as a predictor of future milk yield is underestimated and should be stressed more in replacement heifers.” This does not mean that more emphasis should be placed on genetic selection for height, but rather that more attention should be placed on raising heifers so that they reach their height genetic potential in order that they achieve body mass consistent with reaching their genetic potential for milk yield.
So What Does the Aforementioned Have to Do With Limit-Feeding Dairy Heifers?
Limit-feeding dairy heifers requires management attention and skill to achieve desired results. But first good principles of feeding and management for dairy heifers must be mastered because successful limit-feeding will be dependent on achieving a higher level of feeding and management.
Limit-Feeding Strategies and Results
Limit feeding has been shown to be useful to control growth in other livestock animals such as beef cows (Loerch, 1996), feedlot steers (Loerch, 1990), ewes (Susin et al. 1995), and beef heifers (Wertz et al. 2001). Potential benefits are to reduce feed costs, reduce nutrient excretion, and reduce feedstuffs needed.
Lammers et al. (1999) used a 2 x 2 factorial arrangement with treatments of standard growth rate (0.7 kg/d), accelerated growth rate (1.0 kg/d), standard growth rate with an estradiol implant, and accelerated growth rate with an estradiol implant in a heifer growing trial. All heifers received the same diet, but DMI was adjusted weekly to achieve the target rate of gain based on the 1989 NRC and the Cornell Net Carbohydrate Protein System model. While no negative effects were noted in first lactation performance, there were differences in growth parameters due to rate of ADG (Table 3).
Table 3. Limit feeding effects on growth and performance of Holstein heifers from 19 to 39 wk of age (from Lammers et al., 1999).
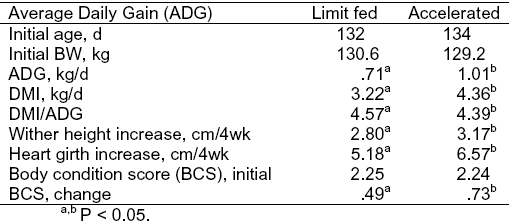
Use of the implant lowered (P<0.06) DMI and decreased (P<0.10) feed efficiency. Since dietary protein concentration was increased for heifers limit fed to equalize protein amount consumed by accelerated fed heifers, lower (P<0.05) ADG, WH, HG, and BCS were due to less energy consumption as a consequence of lower DMI (P<0.05) by limit fed heifers. That raises the question as to whether heifers would have grown the same on both treatments if energy intake was also equalized.
Zanton and Heinrichs (2007) fed Holstein heifers for 245 d either high-forage (75 per cent equally from corn and grass silage--HF) or low forage (25 per cent equally from corn and grass silage--LF) total mixed rations (TMR) to achieve the same ADG beginning at 125 kg of BW and 117 d of age. TMR were fed twice daily at 0800 and 2000 h through Calan gates. Each treatment was in a separate lot bedded with sand so bedding consumption and lack of bunk access were not issues. Growth parameters were not different except for greater (P<0.05) paunch girth with heifers fed the HF TMR. Subsequent age at first calving, BW after calving, and milk production did not differ (P<0.05) although milk peak and 150 d milk yield were numerically greater for the heifers fed the LF TMR. Thus, there was no evidence of negative effects due to limit feeding these heifers on a low forage/high concentrate diet.
In a later study, Zanton and Heinrichs (2008) quantified manure excretion using Holstein heifers at 340 kg of BW and 14.5 mo of age. They were fed a high forage diet (grass silage, grass hay, and corn silage) at 1.25, 1.50, 1.75, and 2.0 per cent of BW. Dry matter intake increased in proportion to feed offered until reaching a plateau at 1.92 per cent of BW. Manure excretion increased at a rate of 2.5 times DMI, and this excretion was entirely due to greater wet feces excretion as amount of urine excretion did not change. As DMI increased, nitrogen (N) digestibility decreased (P<0.011) while N retention increased linearly (P<0.074). N retention efficiency was the lowest at DMI of 1.25 per cent of BW and increased above this to a plateau. Similarly, overall nutrient efficiency decreased with lower DMI down to 1.5 per cent of BW, with all levels of feed offered above this level resulting in similar efficiencies.
Effects of low forage (33 per cent corn silage--LCS) and high forage (77 per cent corn silage— HCS) TMR on rumen parameters were evaluated (Moody et al., 2007) in 298 kg Holstein heifers; and in a second trial, the effects on nutrient utilization and fecal excretion were evaluated in Holstein heifers at 6 mo (172 kg of BW) and 12 mo (337 kg of BW). Rumen pH tended to be lower with heifers fed LCS vs. HCS, but individual rumen VFA and ammonia concentration were not different. As might be expected, mass of rumen contents was lower (P<0.05) for heifers fed LCS. Major differences were in less (P<0.01) wet and dry feces produced by heifers fed HCS for both age groups. As an example of these differences, authors noted that a 6-mo-old heifer receiving the HCS treatment produced approximately the same amount of wet feces as a heifer twice her age and twice her BW receiving the LCS treatment while urine production (kg/d) was not different between heifers receiving HCS or LCS. Total N excretion was not affected by diet although N intake was greater for LCS than HCS in heifers at 6 and 12 mo of age.
What impact might differences in rumen contents/size have on apparent BW gain? Zanton and Heinrichs (2007) found that heifers fed a high forage diet had 11.5 per cent more wet rumen contents than heifers fed a low forage diet. Moody et al. (2007) found that heifers fed high or low forage diets, and restricted-fed, had wet vs. dry rumen contents of 18 per cent and 16 per cent, respectively. While not directly compared, this would indicate that heifers fed restricted amounts of low forage diets could have the same BW gains as heifers fed non-restricted higher forage diets, but, because of less rumen fill, would have truer BW gain.
Table 4. Growth, feed efficiency (FE), excretion, and subsequent first lactation milk production for heifers fed diets at 100, 90, or 80 per cent of ad libitum intake during the prepartum period (Hoffman et al., 2007).
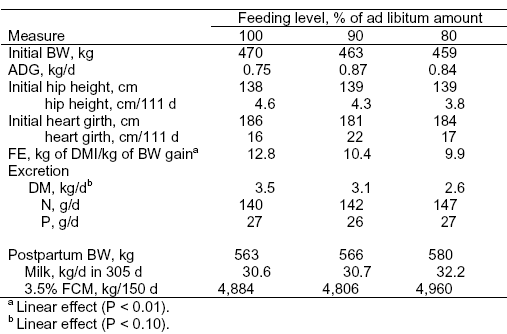
Hoffman et al. (2007) explored a multitude of elements in one trial with pregnant Holstein heifers at 464 kg of BW and 17.5 mo of age. There were 9 pens containing 6 heifers per pen, with 3 replicate pens randomly assigned to one of 3 TMR. The control groups were fed a diet in ad libitum amounts (100 per cent) and based on NRC (2001) recommendations for a 450-kg heifer, that contained 11.3 per cent CP and 2.46 Mcal ME/kg of DM. The 90 per cent and 80 per cent dietary treatments contained 12.7 and 14.2 per cent CP and 2.55 and 2.69 Mcal of ME, respectively. These two diets were formulated to provide similar daily intakes of CP, energy, vitamins, and minerals as compared with feeding the control diet. No differences in the size or body condition scores of the heifers were observed after a 111-d feeding period (Table 4), but there was a 30 per cent linear improvement (P<0.01) in feed efficiency as heifers reduced intake from 100 to 80 per cent ad libitum. Fecal DM excretion was also reduced linearly (P<0.10) with heifers fed the 80 per cent diet producing 40 per cent less total DM excretion compared to heifers fed the 100 per cent diet. First lactation milk yields were similar among these dietary treatments.
Limitations
Hoffman (2007) cautioned that there are some limitations to implementing a limitfeeding strategy. First is the expectation that heifers will vocalize to a minor extent for about one week with vocalization ending thereafter. Second, if adequate bunk space is not available for all heifers to eat at the same time, DMI may be limited for some heifers. When heifers were fed to 80 per cent of their intake potential, they consumed all of the feed available within one hour (Hoffman, 2007). Cows are allelomimetic (Nordlund et al., 2006) in that they all want to do the same thing at the same time. But cows, and heifers, also have a distinct social order. Consequently, Nordlund et al. (2006) found that transition cows responded best in subsequent milk production if the stocking density was 80 to 85 per cent of head lock bunk space available. That means that if there were 100 head lock spaces available, the pen would only contain 80 to 85 cows. This response is due to the most timid cows not coming in to the headlocks to eat unless there was more than one side-by-side headlock open. This is because lower social order cows need to find a less aggressive cow to come alongside for eating at the same time. Heifers are likely to have similar social behaviors as cows. Consequently, lack of adequate bunk space could result in uneven or lower rates of gain with heifers. Consumption of edible bedding can also confound DMI and ADG results.
Field Data
It has been established in research trials cited in this paper that limit feeding heifers can have advantages in decreasing manure output, reducing feed usage, and increasing feed efficiency. But how well might that work on an actual calf/heifer operation? Mason Dixon Farms in Gettysburg, PA has been a family operation since 1784 and has a history of innovation and progressive adaption of new ideas and technology. They began utilizing limit feeding of high energy diets for their heifers in July 2006 under the management of Alan Waybright, initial recommendations by A. J. Heinrichs of Pennsylvania State University, and on-going diet formulation by nutritionist Robert Fry of Atlantic Dairy Management Services. By October 2006, all heifers were on this program, and as of January 2009, about 2000 have had their first calf. At the present time (January 2009), most Holsteins are being bred to Normande Reds. About 250 of present 2,000 heifers are cross-bred, and only 30 cross-bred cows are in lactation. First-calf heifer age averages 23 mo with Holstein pre-calving BW ranging from 556 to 636 kg, and cross-bred BW ranging from 477 to 511 kg. Heifers start the limit feeding program at ~ 4 mo of age and weighing ~125 to 136 kg BW. Primary benefits realized are lower feed costs and less manure. While Mason Dixon Farms has operated a methane generator since 1979, it is not clear if the manure from lower forage-fed heifers works better since it now is more like lactating cow manure.
Table 5. Mason Dixon Farms typical limit-fed heifer diets in January 2009.
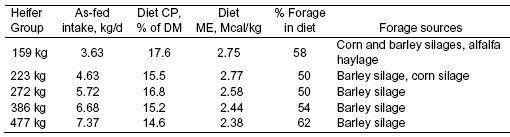
There are 5 groupings of heifers, each with their own ration as noted in Table 5. These diets have been developed by trial and error at Mason Dixon Farms by the nutritionist and the calf/heifer manager. The nutritionist indicates the need for published credible data showing the absolute amount of ME (metabolizable energy) and MP (metabolizable protein) for limit-fed heifers, and for a software program to optimize diets. In addition, he has made the following observations about this limit-fed program for heifers:
- reduction in feed cost due to improved conversion efficiencies,
- adequate bunk space is required for all stock to eat at one time,
- bawling is common in the barn when people or feed equipment are nearby,
- boredom is a concern with an empty bunk for as much as 16 hr/d – more tongue lolling and pen mate sucking,
- body condition will be normal but noticeable is a much smaller abdominal fill. They have a “barrel” more like a finished feeder animal, and
- feed delivery is easy since no one needs to make a bunk call – just feed to the head count.
Summary
Dry matter intake prediction and attainment, dietary energy to protein relationship, maximizing height attainment, and having an adequate daily gain without fattening are key elements of any good heifer-growing program. In various research trials, limit-feeding of heifers:
- has produced targeted ADG if dietary protein and energy concentrations have been adjusted to provide the same amount of protein and energy as for ad libitum-fed heifers,
- has resulted in similar first lactation milk yields as ad libitum fed heifers,
- decreased manure excretion and increased efficiency of N utilization and other nutrients, and
- has been shown to work if adequate bunk space is provided for all heifers to eat at the same time. This is especially critical for heifers lower on the social order.
A large dairy herd has successfully used limit feeding for all of their dairy heifers beginning at 130 kg of BW since 2006. Separate rations with different protein and energy concentrations are provided for 5 groupings. The primary benefits have been in lower feed costs and less manure production. Other observations have also been noted.
Further Reading
| - | You can view a list of the full IFAS 20th Symposium proceedings by clicking here. |
March 2009