Milk and Milk Products
By the FAO. Food Outlook, Global Market Analysis. Dairy prices continue to surge, but uncertainty is rising 26 November 2007
 15 minute read
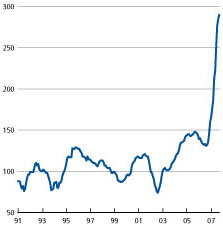
International market prices of dairy products are now well over twice their levels of one year ago. Since the June Food Outlook, the FAO index of dairy product prices (base 1998-2000=100) has risen from a value of 213 in April, to 290 in September 2007. It is almost four times its previous low of 74 observed in 2002, giving evidence that significant changes in the global milk sector may be underway. Higher international prices are being associated with higher domestic prices in many countries, including some of the more protected developed countries, where insulated domestic prices were in the past well above international prices. Given recent developments of prices, these countries may now export profitably, and hence change the structure of world trade.
The index is derived froma trade weighted average of a selection of representative internationally traded dairy products.
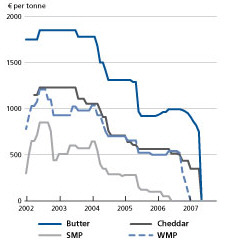
During the spike, prices of milk powders increased the most initially, reflecting the fact that their supplies are largely residual to the product processing systems of most exporting countries, and are least sensitive to prices. As of September 2007, skim milk powder (SMP) and whole milk powder (WMP) prices (Oceania markets) were each up by over 125 percent from September last year and stood at US$4 950/tonne and US$4 750/tonne, respectively. Butter prices have gained the most in recent months, as the European Union public stocks diminished to record low levels, and by September prices were also 125 percent higher than last year, at US$3 700. Cheese prices have increased the least, but were up 88 percent over year ago levels, at US$4 900/tonne.
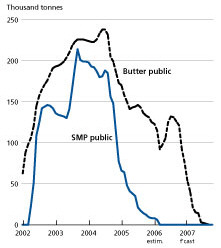
The strong upswing in prices started in the fourth quarter of 2006, after European Union public intervention stocks of SMP were exhausted (see Figure 29). A series of supply side shocks then set markets into a spin. In late 2006, milk production was negatively affected in some regions by a sharp rise in feed prices caused by short global supplies and high demand of feed grain for biofuel. Then, in early 2007, India imposed an export ban on SMP, drought returned to Australia and flooding deteriorated pasture conditions in Argentina and Uruguay. In the third quarter, high feed prices and poor pasture due to hot weather reduced European Union milk production levels. This sequence of shocks, without sufficient stocks to absorb them, moved prices beyond record levels and far higher than ever anticipated.
While prices have continued to rise, there are signs of a turn around. Uncertainty, not about the direction of the price change, but about its timing and extent, is also rising. As farm milk prices surged in many countries, doubling in some cases in South America and higher by 30-40 percent recently in the United States and the European Union, a potential flood of milk products may soon be hitting world markets. While supply shocks underlie the current price spike, supplemented by continued depreciation of the US dollar, the impact of policy changes and underlying high demand growth in key developing countries are key to assessing where markets will land.
|
Table 9. World dairy market at a glance
|
|||||
| 2005 | 2006 estim. | 2007 f'cast | Change: 2007 over 2006 |
||
|---|---|---|---|---|---|
| million tonnes milk equivalent | % | ||||
| WORLD BALANCE | |||||
| Total milk production | 646.5 | 662.7 | 678.2 | 2.3 | |
| Skim Milk Powder (SMP) | 22.3 | 22.3 | 22.3 | -0.3 | |
| Whole Milk Powder (WMP) | 22.1 | 22.2 | 21.8 | -1.6 | |
| Butter | 55.8 | 58.4 | 61.1 | 4.6 | |
| Cheese | 83.2 | 84.6 | 87.1 | 3.0 | |
| Other products | 463.0 | 475.2 | 485.9 | 2.3 | |
| Total trade | 46.0 | 47.3 | 46.7 | -1.4 | |
| SUPPLY AND DEMAND INDICATORS | |||||
| Per caput food consumption: | |||||
| World (kg/year) | 93.8 | 95.1 | 96.2 | 1.2 | |
| Developed countries (kg/year) | 173.5 | 174.3 | 175.3 | 0.6 | |
| Developing countries | (kg/year) | 61.2 | 63.0 | 64.6 | 2.6 |
| Trade - share of prod. | (%) | 7.1 | 7.1 | 6.9 | |
| FAO Price Index | (1998-2000=100) | 145 | 138 | 230 1 | |
1/ Jan-Sept 2007
PRODUCTION
Solid milk production growth in 2007, but not in all the major exporting countriesGlobal milk production is now anticipated to reach 678 million tonnes in 2007, up 2.3 percent from last year, a much lower growth than was expected in the last Food Outlook. Importantly, the slowdown is now expected in a number of key milk product exporting countries. Milk production of the five leading exporting countries, which produce over 40 percent of the world's milk but contribute over 80 percent of global exports, is now expected to remain unchanged compared with year earlier levels. Production declines by Argentina (-7.0 percent), Australia (-5.2 percent), the European Union (27) (-0.4 percent) and the Ukraine (-2.0 percent) may just be offset by gains in the United States (+2.0 percent) and New Zealand (2.5 percent). While this sluggish production growth by exporters can be somewhat attributed to higher feed prices and increased land allocation toward crop production, as opposed to pasture, the main underlying factors have been poor weather and pasture conditions.
The strongest expansion in milk production is in Asia which, as a continent, is expected to increase its milk output by over 5 percent again in 2007, stimulated in many countries by strong economic performance, which has led to higher internal milk prices and increased investments in production, processing and domestic marketing capacity. Fast growth is not forecast to be limited to traditional dairy producers such as India and Pakistan, which are set to increase production by 3 and 4 percent respectively. Indeed, China is expected to boost milk production by 18 percent this year, becoming the third largest milk producing country in the world. High returns and large international investments have spurred development in the Chinese dairy sector in the past ten years and, while many anticipate production growth to slow, it keeps expanding at high rates. It should be highlighted that China is also the world's largest importer of milk products, as demand continues to outstrip domestic supply given its rapid economic growth and despite current high import prices. In other countries in Southeast Asia and in the Middle East, demand for milk and re-constituted milk products has also outpaced supply, although recent high milk prices are fostering growth in production capacity and restraining import demand.
Milk production in Latin American and the Caribbean has been rising fast in recent years and a number of countries has been either emerging more prominently on export markets, or replacing imports with domestic production. In 2007, growth in Brazil, the region's largest milk producer, remained sustained at 3.0 percent, as a result of rising prices in recent years. However, production in Argentina, which increased rapidly in 2006 in response to improved economic conditions, is now anticipated to decline by 7 percent in 2007 as a result of widespread flooding of pastures in key production zones, such as in the province of Santa Fe. Domestic prices in Argentina have also continued to be discounted from high international prices by the application of export taxes, with the objective to protect domestic consumers. Milk production in Uruguay, the other key exporter in the region, is expected to fall, by 3.0 percent, also as a result of poor pasture conditions. In Mexico, one of the world's largest importers of milk powders, attempts have been made to stimulate sector development to limit dependence on imports and milk production is now expected to rise 1.5 percent. However, recognizing the important role of milk powders in domestic food security, import tariff quotas have again been relaxed to assure adequate supplies for social feeding programmes.
In Africa, a slow pace of expansion, in the order of 1 percent, is expected in 2007, reflecting very mixed performance across the continent. Production there continues to be unresponsive to high international prices, as can be expected from a region where informal markets dominate the dairy sectors. Moreover, key producing countries of Kenya and South Africa have been negatively affected by heavy rains and their production will fall by 3 and 5 percent respectively. Production in Algeria, which is the continent's largest importer of milk products, may increase by over 2 percent as a result of high domestic prices and programmes to encourage production. However, some countries, such as Mauritania have apparently sought to cushion the impact of high international prices on domestic consumers through price subsidies; a policy that tends to limit incentives for local producers to expand.
In Canada, where rising milk and milk product prices have depressed domestic demand and reduced milk quota levels, production will be cut accordingly by a 1.6 percent, the third consecutive year of declines. On the other hand, the United States dairy sector continues to grow strongly despite high feed prices, as domestic milk prices have soared, led by firm domestic and external demand. Current United States milk prices are at historically high levels and milk-to-feed price ratios are strongly positive.
In Europe, European Union's milk production in the early months of 2007 showed signs of recovery compared with 2006, but it began to languish by mid-year, because of high temperatures/low water supplies in key producing regions. While weather conditions have played a key role in limiting production in the past two years, the provision of support independently from the level of production has also reduced the incentives for European milk output to expand. The European Union's milk production is now expected to decline slightly in 2007 for the second year in a row, and with low stocks of dairy products, domestic prices have started to soar in recent months. For example, farm prices of milk in September are reported in Germany to have increased by as much as 40 percent over the September 2006 levels. Production response to these higher prices will depend significantly on how production quotas are applied in the future; a theme that will be examined as part of the European Union's "health check" CAP review in 2008. Elsewhere in Europe, production in Ukraine, the other major exporter in the region, has also failed to increase in the last two years and, in 2007, is expected to fall by 2 percent. Meanwhile, milk production in the Russian Federation, the world's largest importer of butter and cheese, is set to increase by almost 3 percent this year in response to investment programmes.
In Oceania, milk producers in both Australia and New Zealand have been benefiting from rising domestic prices, given their significant presence in international markets. However, the benefits from high world prices have been somewhat eroded by the appreciation of their respective dollar currencies, which have each revalued by about 60 percent against the US dollar over the past five years. Furthermore, drought has hit hard in Australia, for the second time in five years. Milk production for the first six months of 2007 was down 10 percent and is likely to remain short for the remainder of the year. Although production had improved in 2006, it is now estimated to be almost 20 percent below its peak level in 2002, and milk product inventories have dwindled to minimum levels, leaving exportable surplus at its lowest in many years. Output in New Zealand has continued to expand in 2007, at 2.5 percent, and with record high farm prices, the country is set to expand further under profitability conditions which the industry has not seen before.
TRADE
Is a change in the dairy market structure coming soon?
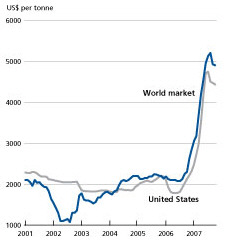
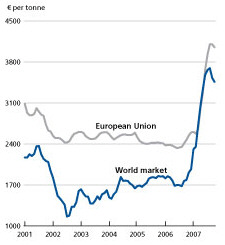
The milk product trade situation this year is largely determined by the tight milk supply situation of the major dairy exporting countries, which after accounting for their own domestic demand growth, implies that, in milk equivalent terms, exports supplies of milk products are expected to decline marginally. Accordingly, trade patterns are heavily influenced by the degree of tightness in these exporting countries, with New Zealand increasing shipments, while Australia, Argentina, the European Union, Ukraine and Uruguay may reduce their exports. The situations in the United States and the European Union appear to be the most interesting, as, at current prices, they may have the potential to increase exports again quickly, without the need of subsidies, and bring prices down. In the United States, where the weak dollar has increased the competitiveness of the dairy sector, the upturn in world prices has induced higher exports of SMP, cheese and butter, which are partly responsible for a large increase in United States domestic milk prices, which, at almost US$480 per tonne, are now are at record levels. Domestic prices for SMP in the United States have run up along with world prices, as shown in Figure 30. The same pattern dominated the European Union, as demonstrated for WMP prices, where domestic prices have run up in parallel with the international price. However, European Union prices of WMP remained above world levels in the presence of export refunds (see Figure 32), as these were eliminated only in June of this year, and will be extended to shipments/contracts for up to four subsequent months. With producer milk prices in some countries of the European Union rising rapidly in recent months, the question is how much the European Union will respond with higher production and exports, given a strong Euro and internal production quotas that may contain future production growth.
The largest and fastest growing milk product market internationally is that for WMP, which has been used for re-constitution or blending in fluid drinking milks as well as for the making of other value added products. New Zealand dominates this market, followed by the European Union, Argentina and Australia. Global exports are expected to fall by 2.8 percent. While exports are expected to increase marginally in New Zealand, and remain about the same in the European Union, they are expected to fall significantly in Argentina (-20 percent) and Australia (-17 percent). WMP import demand remains strong, particularly in China and countries in South Asia and the Near East. However, imports by countries in North Africa are expected to be depressed by high world prices.
It is anticipated that world trade in SMP will be up marginally, largely due to increased exports from the European Union made early in the year, when SMP prices were strongest relative to other products. Exports from the United States, which has become the world's second largest supplier of SMP, are also expected to increase to a new record, underpinned by the strong world prices. New Zealand's exports of SMP are expected to increase by almost 7 percent. Again due to short supplies, trade from Australia, Argentina and Ukraine is expected to be down considerably from their normal levels. SMP imports into Asia remain strongest, in particular in China, Philippines, Thailand and Saudi Arabia, while in the other regions, Algeria and Mexico, two large importers, have reduced imports significantly in the past several years in an attempt to replace imports with domestic supply.
International butter and cheese markets are heavily affected by tariff quotas, and where quota has been binding, such as in Canada, the European Union, Japan and the United States, trade may remain stagnant. As much as this factor, the increases in demand as incomes rise are much higher for these products than for milk powders. The same is true for trade in more highly processed dairy products whose coverage is beyond the usual scope of this outlook, including milk protein concentrates, and casein, etc. The point is that demand for these products in countries such as the Russian Federation is growing rapidly, underpinning trade (see box).
Why is international demand for dairy products so strong?
What explains why importers are paying such high prices for milk products? The implicit prices of butterfat relative to vegetable oil, and of milk proteins to vegetable proteins are currently far out of proportion. Skim milk powder and whole milk powder imports by developing countries have changed little despite prices being over twice the levels of last year. The answers to these questions point to a changing market environment. The following points should be made:
-
Per caput income growth of key importers has been significant in 2007, particularly China (9.5 percent), Russian Federation (7 percent), countries of Southeast Asia (3-4 percent), Algeria (3 percent) and Mexico (3 percent). Many commodity based importers have increased foreign exchange earnings due to the commodity price boom, post 2000.
Effective prices of milk products purchased by importers from Oceania, South America and Europe are not as high as indicated in depreciated US dollars.
Most exports are made in forward contracts, at prices fixed up to six months in advance of shipment, so demand impact is delayed.
Milk powders are reconstituted and blended with fresh domestic milk, and hence high prices may have less, or a delayed, impact on the final cost to consumers.
Some developing countries have been subsidizing imports as part of social feeding programmes. At current prices these will be expensive to continue.
| Table 10. Major exporters of dairy products | |||
| 2005 | 2006 Preliminary | 2007 Forecast . | |
|---|---|---|---|
| thousand tonnes | |||
| WHOLE MILK POWDER | |||
| World | 1 769 | 1 823 | 1 771 |
| New Zealand | 585 | 645 | 680 |
| EU-251 | 486 | 412 | 412 |
| Argentina | 162 | 215 | 172 |
| Australia | 157 | 169 | 140 |
| SKIM MILK POWDER | |||
| World | 1 110 | 1 182 | 1 200 |
| United States | 281 | 292 | 300 |
| EU-251 | 189 | 84 | 140 |
| New Zealand | 221 | 316 | 337 |
| Australia | 166 | 184 | 150 |
| BUTTER | |||
| World | 910 | 907 | 907 |
| EU-251 | 311 | 243 | 240 |
| New Zealand | 320 | 368 | 380 |
| Australia | 68 | 81 | 60 |
| Ukraine | 24 | 18 | 17 |
| CHEESE | |||
| World | 1 590 | 1 629 | 1 645 |
| EU-251 | 546 | 582 | 605 |
| New Zealand | 263 | 299 | 316 |
| Australia | 208 | 209 | 195 |
| Ukraine | 116 | 50 | 60 |
Further Reading
|
|
- To view the full article, please click here. |
November 2007