US dairy market and policy overview
The marked changes in US dairy markets and policy during the late 20th and early 21st centuries are discussed. 24 January 2022
 7 minute read
Correlation analysis suggests current US dairy policy provides less protection against declines in net return for the smallest dairy farms. This finding prompts a policy equity issue: “Should dairy policy be fair across herd sizes?” If it is decided that this issue is worth addressing, a per cow payment for a policy specified, limited number of cows is a potential policy option.
Brief History of US Dairy Policy:
The Agricultural Adjustment Act of 1933 designated milk and its products as basic commodities (National Agricultural Law Center, 2021). Marketing agreements were instituted in a number of fluid milk areas that raised producer prices by controlling the volume and timing of milk sales. Support prices were imposed for milk during World War II and retained after the war.
Prices were supported by government purchases of butter, cheese, and nonfat dry milk. Payments for producing milk started in 1999 when ad hoc Market Loss Assistance Payments were authorized for milk and other farm commodities in response to a sizable decline in commodity prices associated with a global financial crisis. Ad hoc payments were also authorized in 2000 and 2001. The 2002 farm bill continued payments by authorizing monthly deficiency payments if the Class I milk price in Boston was less than $16.94 per 100 pounds (cwt.).
The 2014 farm bill replaced both this milk deficiency payment program and the price support program with a Dairy Margin Protection Program. It made payments when the margin difference between US average all milk price received by farms and cost of feeds was less than a specified value. Feeds were corn, soybean meal, and alfalfa. The 2018 farm bill renamed the program, Dairy Margin Coverage (DMC). The basic formula was retained but many payment parameters as well as calculations used in the formula were modified.
Milk Price and Return Variability:
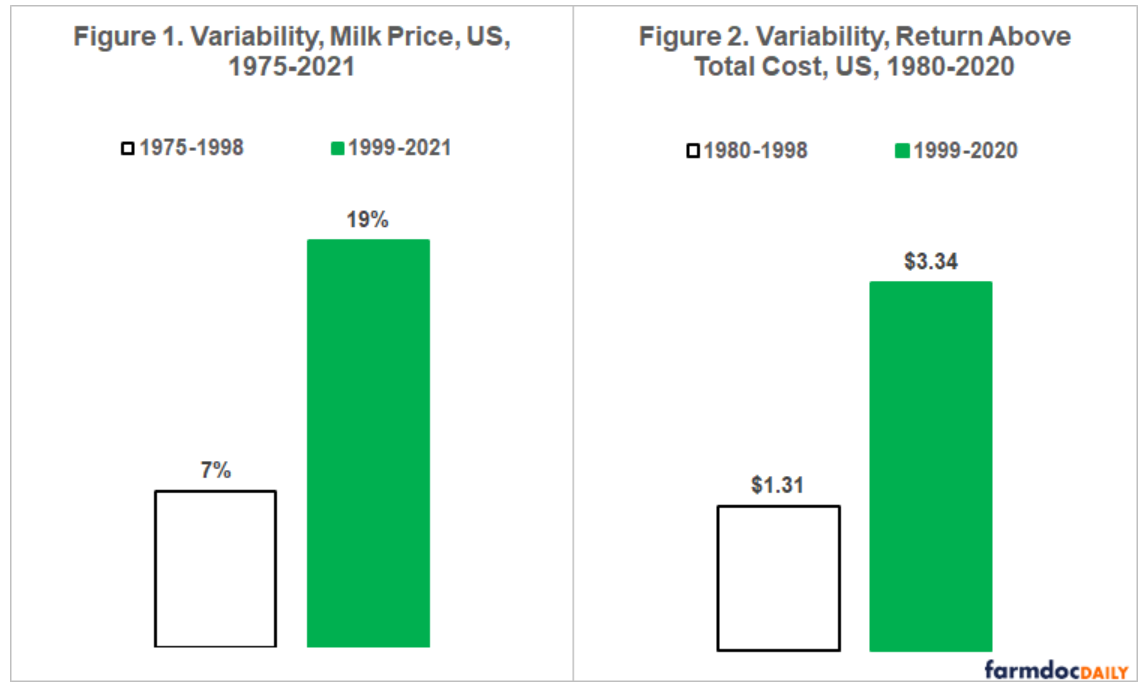
Milk prices have been much more variable (+162%) during the 23 years with dairy payments than during the preceding 23 years (see Figure 1). This widely noted increase reflected federal policy decisions to first lower, then eliminate milk support prices that had kept milk prices higher than market clearing levels. Price variability is measured as (standard deviation of percent change in average annual price per cwt. of milk paid to US farms).
A similar increase in volatility (+155%) occurred in net return above total cost as reported by USDA (US Department of Agriculture) (see Figure 2). Net return volatility is measured as (standard deviation of annual change in net return above total cost in $/cwt. of milk). Milk cost and return data were first reported for 1980. The increase in variability of milk price and net return was one reason US dairy policy changed from a price support to a milk price-feed cost margin program.
Milk Production:
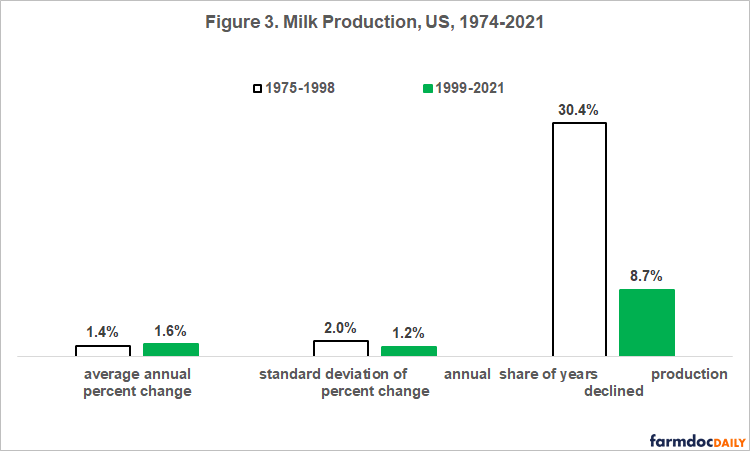
US production of milk has grown on average 18% faster per year since 1998, the period of dairy policy payments (see Figure 3). One reason is that the elimination of price supports increased competitiveness of US dairy exports. When measured on a skim solid basis, US commercial dairy exports increased from a 5% share of total use at the turn of the century to 22% currently. The increase is less dramatic but still notable when measured on a fat basis: 1% to 5%. Growth differs because world demand is relatively stronger for milk solid products, such as skim milk powder and lactose, while US demand is relatively stronger for milk fat products, such as cheese and butter.
Variability of US milk production also declined (-38%). Years in which production declined from the prior year dropped a dramatic -71% (see Figure 3). Since 1998, US milk production declined only in 2001 (-1.2%) and 2009 (-0.4%). The last decline is 12 years ago and counting.
Herd Size:
US farms producing milk declined from 333,620 in the 1978 Census of Agriculture (see Data Note 1) to 54,599 in the 2017 Census of Agriculture, an 84% decline. As with most of US farming, surviving producers have gotten larger on average. Share of dairy cows on the largest 1.3% of US dairy farms increased from 10.8% to 31.7% between the 1978 and 2017Censuses (see Figure 4). These farms had 200+ cows in 1978 but 2000+ cows in 2017. The increase in share of cows on the largest dairy farms roughly matches the decline in share of cows on the smallest 50% of dairy farms (see Figure 5). It is not possible to create the same exact share of dairy farms across agricultural censuses because each census reports data for only certain herd sizes.
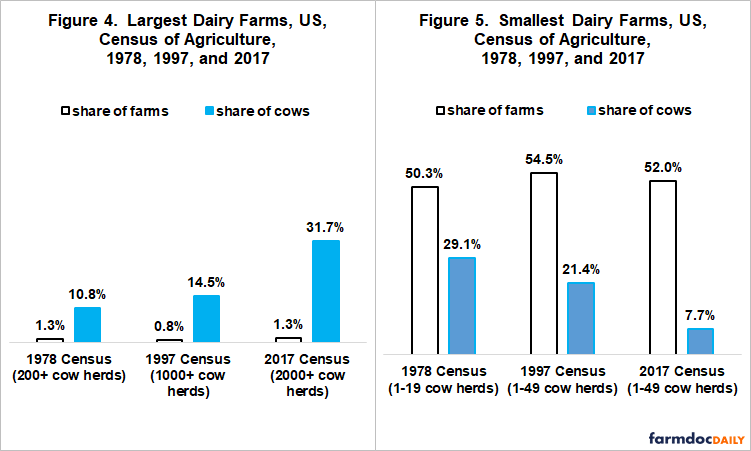
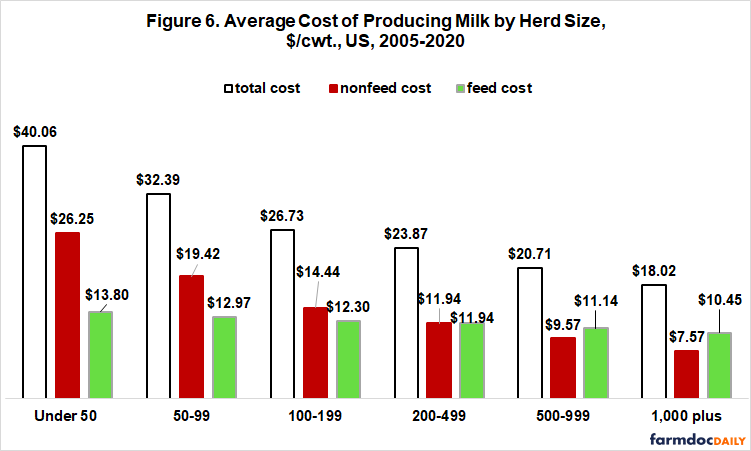
Using data from the 1997 Census of Agriculture as a midpoint observation reveals that the transfer of cows from roughly the smallest 50% to largest 1% of dairy farms has been continuous since 1978. A likely reason for the consistent shift is economy of size in producing milk. Total cost per cwt. declines sharply as herd size increases (see Figure 6). The largest dairy herds produce milk at less than half the total cost of the smallest dairy herds ($40.06/cwt vs. $18.02/cwt.). Primary driver of economies of size is nonfeed cost. For example, relative to the smallest herd, cost advantage of the largest herd is 71% for nonfeed ($7.57 vs. $26.25/cwt.) vs. 24% for feed ($10.45/cwt. vs. $13.80/cwt.).
Policy across Herd Size:
Current US dairy policy makes payments when the milk price-feed cost margin is below a specified value. Policy effectiveness across herd sizes thus depends on the correlation of changes in milk-feed margin across herd sizes. This effectiveness is explored by computing the correlation for (net return above feed cost reported by USDA for all herd sizes) with (net return above feed cost for a given herd size). All correlations are very high. Smallest is 0.96 for 1-49 cow herds (see Figure 7 and Data Note 2). Perfect correlation is 1.0. The high correlations likely reflect in part relatively similar feed rations, which in turn results in relatively similar feed cost per cwt. across herd size (see Figure 6).

However, feed is not the only cost. Moreover, non-feed cost vary notably by herd size (see Figure 6). Efficacy of a program based on the milk–feed margin thus depends on how closely correlated are (changes in milk–feed margin) with (changes in net return above total cost). This effectiveness is examined by calculating the correlation between (year-to-year changes in net return above feed cost for all herd sizes) and (year-to-year change in net return above total cost for each herd size).
Dairy herds with less than 50 cows have a notably smaller correlation of 0.79. Correlation is 0.95 for herds of 50-100 cows and exceeds 0.98 for all larger herds. The differences in correlations are more important than they may appear. The reason is that the share of year-to-year change in net return above total cost for a given herd size that is explained by year-to-year change in net return above feed cost for all herd sizes is the square of the correlation. This value varies from 63% (0.79 times 2) for herds of less than 50 cows to 90% for 55-99 cow herds to 97% for all larger herd sizes. Compared with herds of more than 100 cows, changes in the milk-feed margin explain substantially less of the changes in net return above total cost for dairy herds with 1-49 cows. Thus, a milk-feed margin program provides the smallest dairy farms as a group with less protection against declines in net return.
Summary Observations
Since the US began transitioning to a milk payment program from a milk price support program in the late 1990s, variability of milk price and net return has increased notably.
Analysis in this article suggests a program that bases dairy policy payments on the milk price-feed cost margin, such as the current DMC program, provides the most protection against decline in milk profitability for the largest dairy farms. Protection is notably less for dairy farms with less than 50 cows, with some slippage for dairy farms with 50-99 cows.
This finding prompts a policy equity issue: “Should dairy policy be fair across herd sizes?”
If policy deliberations conclude that this fairness issue should be addressed, a per cow payment for a policy specified, limited number of cows per dairy operation is a potential policy option.
This policy option is in essence a policy addendum to DMC to mitigate an equity issue created by DMC without changing DMC.
It could be implemented by basing the per cow payment on the decline in net return not covered by the change in DMC’s milk-feed margin for dairy operations with less than a given number of cows.
Payment could be restricted to herds with less than the given number of cows. However, such limits are usually difficult to effectively implement because farms rearrange their operation to qualify for payments. A per cow payment up to the given number of cows could thus be made to all dairy operations. Small dairy farms would however receive the greatest benefit since a larger share of their cows receive a payment.
TheCattleSite News Desk