Strait of Hormuz disruption scenarios and fertilizer purchasing risks for US producers
University experts offer pricing scenarios and outlook
 7 May 2026
 8 minute read
 By:
By: Following the collapse of U.S.-Iran peace talks in Islamabad on April 12 and the announcement of a U.S. naval blockade effective April 13, commercial traffic through the Strait of Hormuz remained severely constrained. The April 2026 NDSU Agricultural Trade Monitor introduces a global fertilizer model to examine what that disruption could mean for fertilizer markets if shipping conditions normalize quickly, remain contested, or deteriorate further (Arita et al., 2026c).
The scenario analysis is useful for US crop producers because the Persian Gulf normally accounts for about 40% of globally traded urea exports and roughly 44% of seaborne sulfur, both of which are central to nitrogen and phosphate markets. This discussion focuses on how high prices could rise, how long they could stay elevated, and why the 2027 fertilizer purchase window may be more exposed than the 2026 spring season.
Price projections remain elevated in all three scenarios
Figure 1 shows that urea is projected to remain well above the February 27 pre-crisis NOLA benchmark of $470 per short ton under all three scenarios. Under a “Quick Reopening” scenario, urea peaks at $782/st in June 2026 and then eases gradually. Under the central “Contested Transit” scenario, the peak reaches $784/st in July, with prices staying above $700/st through November. Under the “Extended Conflict” scenario, the projected peak shifts later and higher, reaching $996/st in October. The contrast across scenarios is less about the initial jump than the duration of tightness. Even when absolute peaks differ only modestly between the “Quick Reopening” and the “Contested Transit” scenarios, the central scenario keeps prices elevated for a longer period into the normal fall and winter purchasing cycle.
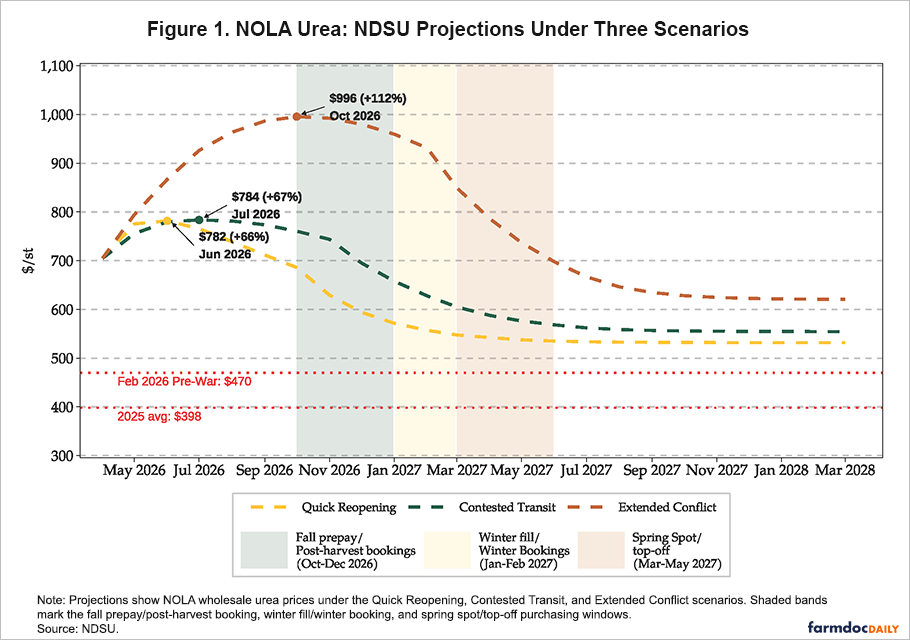
DAP follows a different pattern. The initial increase is smaller than for urea, but the decline is slower because a Hormuz disruption also tightens sulfur supplies, an important feedstock for phosphate production. DAP is projected to peak at $866/st under the “Contested Transit” scenario and $945/st under the “Extended Conflict” scenario, both well above the February 2026 pre-crisis benchmark of $622/st. Even in the optimistic case, DAP does not return to pre-crisis levels quickly. Reported damage to Gulf energy and fertilizer infrastructure in Qatar and Iran, together with delays in mine clearance, insurance normalization, and backlog clearance, makes a rapid return to the early-2026 price environment unlikely. Overall, the projections point to a prolonged period of elevated fertilizer costs rather than a short-lived spike.
The scenarios are useful because they map to distinct buying environments across the growing season (Arita et al., 2026b). The “Quick Reopening” scenario assumes the Strait is functionally operational by July, while the “Contested Transit” scenario assumes vessel traffic improves, but only under continued security risk and partial normalization. In contrast, the “Extended Conflict” scenario assumes severe disruption persists through fall 2026.
For US crop producers, the practical distinction is that the central scenario still allows some easing by early 2027, while the pessimistic case pushes the highest nitrogen prices directly into the fall booking season and winter fill.
Purchasing windows matters more than the spot market
For most US producers, the more important question is not today’s spot quote but the price likely to prevail during the windows when fertilizer is booked. Much of the spring 2026 nitrogen had already been contracted before the Strait closure (Chakravorty et al., 2026), so the larger budgeting concern now is the 2027 crop.
Table 1 translates the scenario paths into the timing most relevant for Midwestern growers. Under the “Contested Transit” scenario, fall prepay urea averages $733/st, or 56% above the pre-crisis level. Winter fill averages $643/st, and spring top-off purchases average $590/st. Under the “Extended Conflict” scenario, fall prepay climbs to $989/st, winter fill to $945/st, and even spring spot purchases remain near $791/st. Retail prices in the interior Corn Belt would typically run another $50 to $80/st above those NOLA benchmarks once freight, storage, and dealer margin are included.
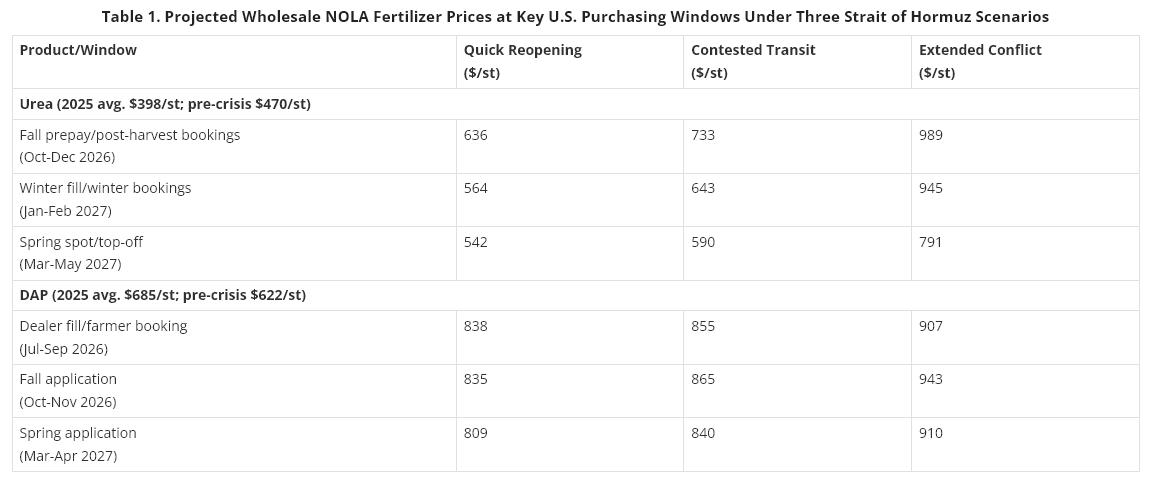
DAP offers even less timing relief. Because most Corn Belt phosphorus and potash is booked and applied in the fall, the relevant comparison is dealer fill and fall application rather than a spring rebound. Under the “Contested Transit” scenario, DAP averages $855/st during dealer fill, $865/st during fall application, and $840/st even by spring 2027. Under the “Extended Conflict” scenario, the comparable averages are $907/st, $943/st, and $910/st.
These patterns suggest that a producer who delays buying is not necessarily rewarded with a materially better phosphate price. In that respect, the focus shifts from whether fertilizer prices will be high to whether they remain high during the specific calendar windows when farm managers usually make purchasing decisions.
The timing issue is especially important because the three scenarios diverge most clearly in the months surrounding post-harvest bookings and winter fill. Under the central scenario, some relief emerges only after the main fall commitment period has already passed.
Under the pessimistic scenario, that relief is delayed even further. This means that the summer and early fall of 2026 are not just a period of market observation; they are the months in which growers will learn whether the market is moving toward gradual normalization or toward another leg higher in 2027 input costs.
2026 could be more painful than 2022 even if nominal peaks are lower
Figure 2 places the 2026 projections beside the 2022 Russia-Ukraine fertilizer shock. Under the “Contested Transit” scenario, urea peaks below the 2022 NOLA high in nominal terms, and DAP also remains below its 2022 record. But the shape of the price cycle looks different. The 2022 episode was a sharp, V-shaped surge driven by panic buying, followed by a relatively rapid retreat (Arita et al., 2026a). By contrast, the 2026 projection shows a slower build, a plateau that extends through fall, and a normalization path that remains structurally above pre-crisis levels. The difference matters because a prolonged stretch of elevated prices is harder to manage through timing alone than a short spike that quickly reverses.
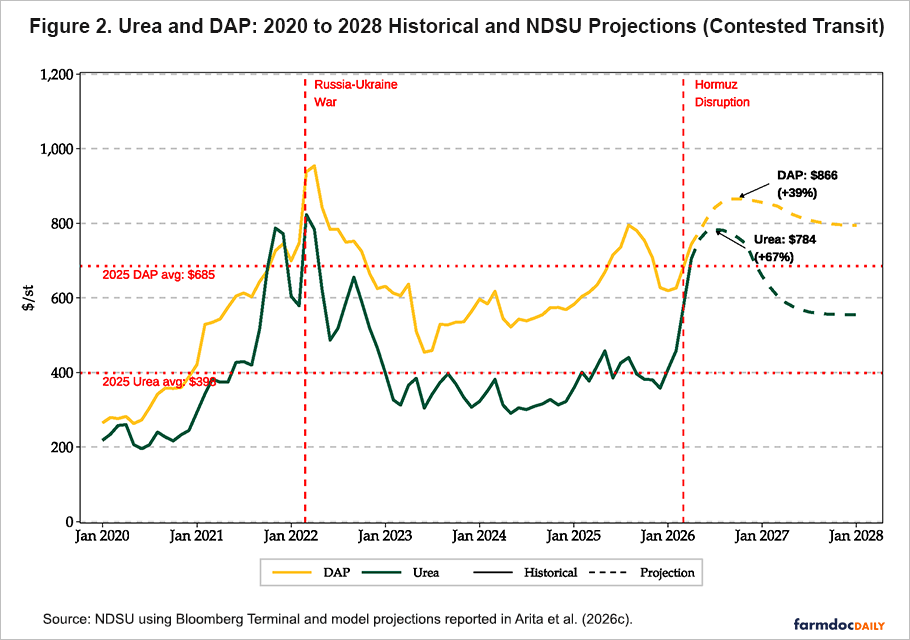
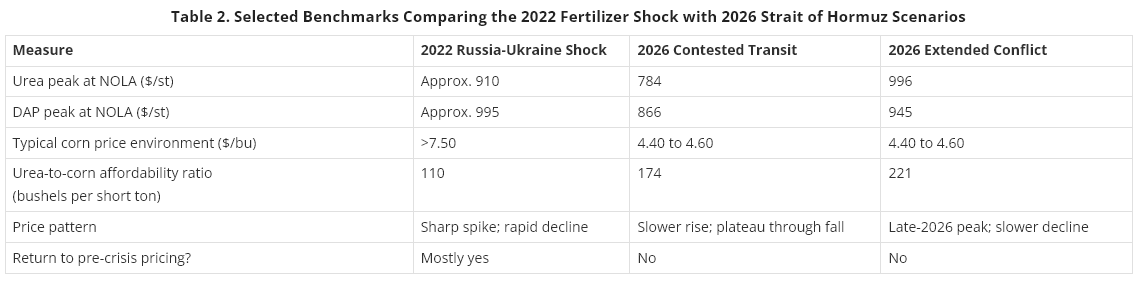
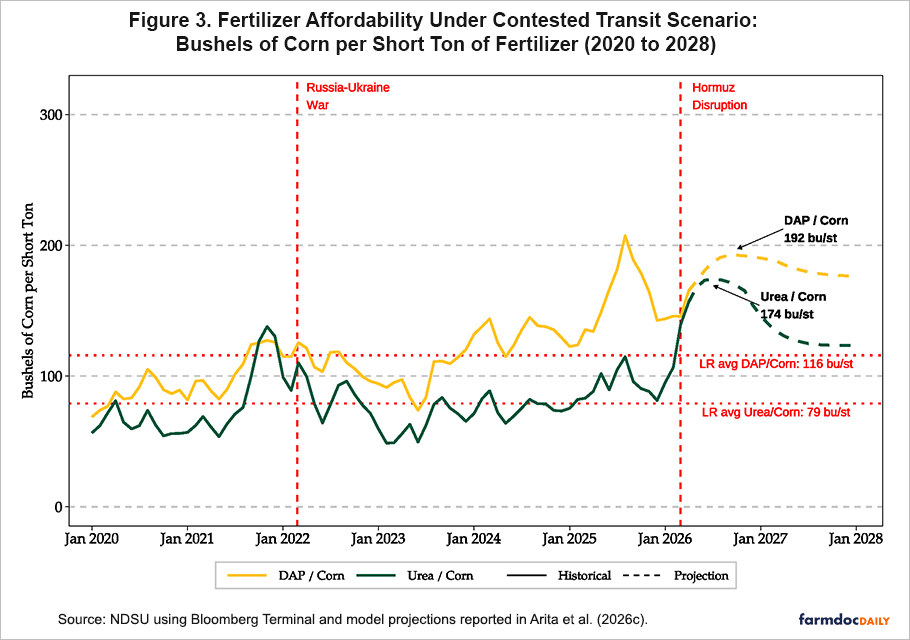
Table 2 shows why lower nominal peaks do not automatically imply less economic stress on farms. In 2022, higher crop prices partially offset the fertilizer shock, with corn moving above $7.50/bu at the height of the market response. In 2026, nearby corn futures are closer to $4.40-$4.60/bu, leaving much less revenue support. Under the “Contested Transit” scenario, a urea-to-corn affordability ratio of 174 bushels per short ton is projected, compared with 110 at the 2022 peak and a long-run average of 79. Under the “Extended Conflict” scenario, the ratio rises to 221 bushels per short ton.
Figure 3 also shows that the DAP-to-corn ratio remains well above its long-run average of 116. These comparisons suggest that the present episode could feel more restrictive at the farm level than 2022, even if the sticker price on fertilizer never quite reaches the earlier record.
US timing helps some, but not enough to remove risk
The United States is somewhat better positioned than some other major importers, but the advantage is limited. Under the “Contested Transit” scenario, the heaviest U.S. urea import window arrives later, in early 2027, after some normalization is already underway. Brazil’s main import season, by contrast, runs from July through November and overlaps more directly with the period of highest projected prices.
Under the “Contested Transit” scenario, average urea prices during Brazil’s peak import months reach $769/st, compared with $630/st during the US January-March 2027 window. For DAP, however, that timing advantage nearly disappears because sulfur-related tightness keeps phosphate prices high longer. The projected DAP average is $859/st during Brazil’s window and $851/st during the U.S. spring application window.
Unsubsidized importers bear much of the adjustment to global demand when prices rise. Under the “Contested Transit” scenario, cumulative urea demand destruction reaches 7.0 million metric tons on a seasonally weighted basis; under the “Extended Conflict” scenario, the pullback rises to 10.1 million metric tons. Brazil, the European Union, and the United States account for a meaningful share of that adjustment, while India’s fertilizer subsidy dampens the domestic price response and limits its demand pullback.
In the “Extended Conflict” scenario, the model projects Brazil’s urea import reduction at about 1.94 million metric tons and the U.S. reduction at 0.68 million metric tons. These are import-demand projections rather than direct estimates of on-farm application, but they point to the same conclusion. U.S. producers benefit from some domestic production and calendar protection, yet they remain tied to a global market that would still be rationing supply.
Outlook
The policy response is beginning to align with what fertilizer markets have already been signaling. On April 16, Agriculture Secretary Rollins told the House Appropriations Committee that the administration plans to use tariff revenues to support domestic fertilizer production, while acknowledging that any price relief will take months rather than weeks. At the same time, an American Farm Bureau survey of about 5,700 farmers found that roughly 70% were unable to afford all the fertilizer they needed for the 2026 crop. Together, these developments reinforce the scenario analysis presented here. Even if the disruption proves relatively short, the period of greatest price pressure still overlaps with the window when many producers must make fall prepay decisions.
For U.S. crop producers, the next several months will determine whether fertilizer prices begin to ease in time to matter for 2027 purchasing plans. The key questions are whether the ceasefire survives the current escalation, whether vessel traffic through Hormuz begins to recover materially, and whether commercial shipping can resume at scale once mine clearance and insurance conditions improve. Even under cooperative conditions, those steps take time. That lag between a political agreement and the first meaningful fertilizer cargo movements is why prices remain elevated even under the “Quick Reopening” scenario.
The practical implication is straightforward. Fertilizer budgets for the 2027 crop should be built around higher nitrogen and phosphate costs than seemed likely before the Strait closure. A shorter disruption could allow some easing before winter fill and spring top-off purchases. But if normalization is delayed, the heaviest price pressure will continue to fall on the normal booking window for fall 2026 and winter 2027. The central question is no longer whether the Strait of Hormuz matters for fertilizer markets, but whether traffic recovers soon enough to materially reduce the next round of farm input costs.
Reference
Arita, S., M. Wang, J. Kim, R. Chakravorty and S. Steinbach. "Strait of Hormuz Disruption Scenarios and Fertilizer Purchasing Risks for U.S. Crop Producers." farmdoc daily (16):75, Department of Agricultural and Consumer Economics, University of Illinois at Urbana-Champaign, April 29, 2026.