

Slaughter Cattle Over a Buck: Past and Present
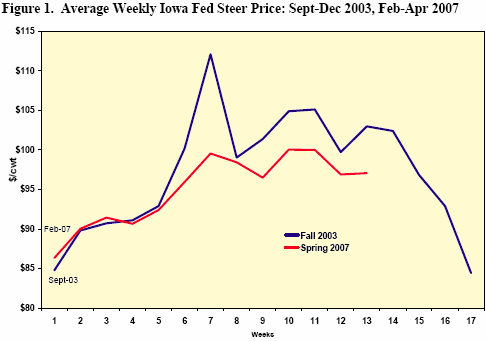
By Shane Ellis, Iowa State University Extension, Economics Department and published in Iowa Farm Outlook Newsletter. It doesn’t happen very often, but when it does it gets attention in the beef industry.The three digit threshold of $100/cwt for live fed cattle has only been crossed a few times, and all occurrences have been within the fourth quarter of 2003 and in the second quarter of 2007. Figure 1 is a graph of weekly Iowa fed steer prices during fall 2003 beginning in September and spring 2007 beginning the first week of February. Although this April’s price peaks were not as pronounced or variant as those in 2003, the general trend of higher and then lower weekly prices are similar.
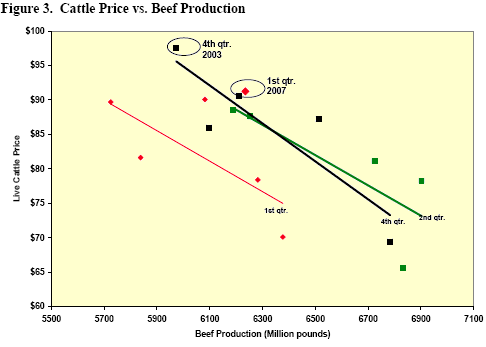
The US beef industry continues to increase beef production while at the same time the nation remains a net beef importer, so let us examine how prices and consumption have interacted. Figure 3 is a scatter plot of quarterly beef production and live cattle prices from the first, second and fourth quarters of the past 5 years. The third quarter was excluded to improve clarity. Trend lines were added to show the general direction of the supply and price relationship. In the first quarter of 2007 cattle prices were well above the normal trend line, indicating a shift away from the normal first quarter demand curve and moving closer to that of second quarter demand. Record high prices of 2003 were fairly close the normal third quarter trend line. Less production during that period resulted in increased prices.
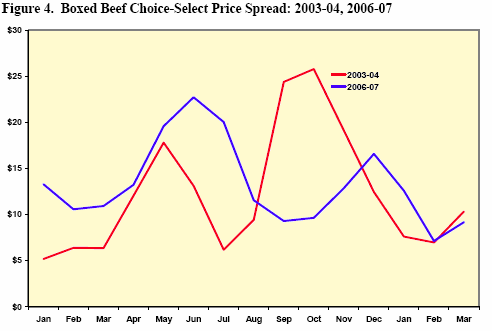
Packer buying behavior can also be influenced by the choice-select price spread and the value of animal byproducts. Figure 4 is a graph of the choice-select boxed beef price spreads for 2003 and 2006. Prior to and during the record prices in the last part of 2003 the spread was significantly wider, and then narrowed as cattle prices remained high. The recent cattle price run up was preceded by a narrow choice-select spread, so competition for the “well finished” cattle was not a likely contributor to the recent $100/cwt cattle prices. Meanwhile, the value of animal co-products is up as much as 17 percent from a year ago, for additional value of $2/cwt of live weight.
