Genetic Evaluations Using Combined Data from All Breeds and Crossbred Cows
By Paul VanRaden and Melvin Tooker - Animal Improvement Programs Laboratory, USDA. 21 May 2007
 9 minute read
Summary
National genetic evaluation programs were modified to include data from crossbred animals. An all-breed evaluation system was compared with previous within breed evaluations. Genetic differences among breeds seemed to be estimated well, and convergence was fairly rapid, which indicated sufficient within-herd connections among purebred and crossbred groups. Joint evaluation of all breeds and crossbred animals can provide more information but does not greatly change rankings for animals that have herd mates and most relatives from the same breed. Changes were largest for breeds with small populations. Additional herd mates of another breed can add accuracy but can also cause bias if they are managed differently or if genetic effects are not modeled correctly. Breeders can compare breeds and design crossbreeding programs using information from the all-breed evaluation. Implementation is expected in May 2007.Background
Genetic evaluations in the US have compared animals within each breed. The USDA animal model is a series of programs used since 1989 that calculates Predicted Transmitting Ability (PTA) by comparing records of cows within the same breed, lactation group (first vs. later), registry status, and management group (two or more month calving period) within each herd and year. With that system, contemporaries groups, pedigree files, and genetic bases were separate for each breed. Holsteins were compared to Holsteins, Jerseys with Jerseys, and so forth. Crossbred animals, unless they were part of a breed association grading up program, were not included. Daughters of other breed sires such as Swedish Red, Montbeliarde, and Normande also were excluded from being evaluated. Rather than exclude these animals from evaluations, the Animal Improvement Programs Laboratory (AIPL) has researched several methods to include all breeds and crossbreds together in routine genetic evaluations.Crossbreeding is of increasing interest to dairy producers and dairy geneticists. The number of first-generation (F1) crossbred dairy cows with usable yield records was about 10,000 in 2001, the latest birth year with complete data. This exceeds the numbers of purebred Brown Swiss, Guernsey, Ayrshire, or Milking Shorthorn cows. Holsteins became popular in many countries because of superior milk production, but some crossbreds have economic merit that is comparable with purebred Holsteins and may exceed Holstein merit if calving ease, calf livability, cow fertility, and cheese yield pricing are considered. AIPL began including data from crossbred and purebred Brown Swiss and Holstein calves in US calving ease evaluations in 2005.
Most countries use the animal model for within breed evaluations of dairy animals with the exceptions of New Zealand and the Netherlands where all-breed evaluations are used. An all-breed model has also been used to evaluate US dairy goats since 1988 and beef cattle in Ontario since 1994. Inclusion of data from crossbred animals can lead to more reliable evaluations of purebred relatives, more accurate comparisons of genetic merit among all potential mates, and improved breeding programs that identify the best gene combinations. Goals of this research were to compare methods for evaluating mixed-breed populations and then to apply the best methods for routine evaluation of US dairy cattle.
All-Breed Animal Model
The all-breed animal model uses lactation records from 1960 to the present, including crossbred records. The total number of cows with records in the national database as of 2006 ranged from 10 to 22 million for milk, fat, protein, somatic cell score (SCS), productive life (PL), and daughter pregnancy rate (DPR). The all-breed model developed was similar to that used for US goat evaluations with the main difference being the computation of general heterosis or hybrid vigor. Estimates of heterosis for individual traits were previously estimated and were not recalculated.Pedigrees for over 46 million dairy cattle were traced to the earliest ancestors recorded electronically, with a lower birth year limit of 1950 because earlier ancestors were not stored. Most animals (99%) had ancestors of only1 breed, but 431,000 had ancestors of more than1 breed. Of those, more than 350,000 had breed compositions with less than 94% of1 breed and greater than 6% of another breed because the crossbreeding occurred within the most recent 4 generations of the pedigree. Beginning in November 2005, the percentage of primary breed was reported for bulls and cows with pedigrees that contain more than1 breed.
Breed composition of the cows with first lactations in 2004 included 90.9% Holsteins, 6.2% Jerseys, 0.8% Brown Swiss, 0.4% Guernseys, 0.3% Ayrshires, <0.1% Milking Shorthorns,1.2% F1 crossbreds (coefficients of heterosis >50%), and 0.3% backcross cows (coefficients of heterosis >25%). Nearly all F1 cows had Holstein as one parent breed, and contributions from the other breeds were proportional to population size. The number of F1 crossbreds doubled in the last 3 yr. For bulls born since 1997, only 4 Jerseys and1 Brown Swiss had >25 crossbred daughters, and each of these bulls had >200 purebred daughters. More recently, semen from Scandinavian Red and French breeds was imported and the resulting daughters are nearly all F1 crossbreds. Since 1987, over 5,000 herds had at least1 crossbred cow, and currently1,377 herds were coded as mixed-breed herds containing >25% crossbreds or cows of a different breed.
Unknown-parent groups in the animal model were separated by breed, pedigree path (dams of cows, sires of cows, and parents of sires), national origin (US or foreign), and birth year. Groups were formed when they included at least 500 animals within a time period and at least 2,000 animals across all years. The grouping pattern was similar to that for Dutch evaluations except that it required only 40 animals per group. Larger numbers are needed for traits with lower heritability. Crossbred ancestors with no records and only one progeny were kept in the relationship matrix and treated as known so that the system of equations could link animals with records back to purebred ancestor groups.
Heterogeneous variance adjustments were modified for all-breed analysis of production traits and DPR. For mixed-breed herds, variance within herd would be overestimated if no account were taken of breed differences. Variance adjustments for milk, fat, and protein were previously based on ratios of milk variances, but variances of fat yield were used in the all-breed analysis. Variance adjustments were not used for all-breed PL and SCS evaluations because they had not been used previously in official within-breed evaluations. Data for other breeds were adjusted to make genetic variance equal to Holstein base cows.
Age-parity-season adjustment factors have adjusted yield traits to mature equivalence. However, economic comparisons are more precise if records are adjusted to younger or more central ages, because more cows have records at those ages and maturity differences may be inherited. As a result, adjusted yields were lower by about 5% for Guernseys; 10% for Holsteins, Jerseys, and Ayrshires; and 15% for Brown Swiss and Milking Shorthorns. Sire breed was used to adjust crossbred records. Holstein factors were applied if the sire was crossbred or if the cow’s breed was not listed above. Additional age-parity-region-time factors were included in the animal models to account for gradual changes that might occur after the multiplicative pre-adjustments for age-parity were developed in 1995. These were estimated separately in the within-breed animal model from the data for each breed, but were estimated as uniform effects across breeds in the all-breed model. Recent age effects indicated that cows of all breeds are more productive at early ages relative to mature ages when compared with estimates from past decades.
Management groups in the within-breed evaluation were separate for registered and grade Holsteins if at least 5 cows of each type were present, whereas cows within the other breeds were grouped together regardless of registry status. In the all-breed evaluation, crossbreds were grouped together with registered or grade cows to allow estimation of breed differences. Crossbred cows sired by Holstein bulls were treated as grades, but all cows sired by bulls of other breeds were treated as purebreds and grouped with purebred cows. For within breed evaluations, heritability of yield traits for Jerseys and Brown Swiss was higher (0.35) than for other breeds (0.30). For the all-breed model, the higher heritability for daughters of Jersey and Brown Swiss sires was accounted for by adjusting their lactation-length weights.
Conversions between all-breed and within-breed bases involved both a mean and the standard deviation ratio for traits with variance adjustment that differed by breed:
within-breed PTA = (all-breed PTA - breed mean) (breed SD/Holstein SD);
all-breed PTA = (within-breed PTA × Holstein SD/breed SD) + breed mean.
Results
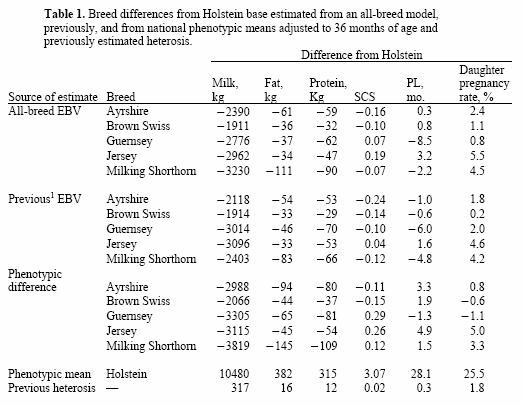
Evaluations from an all-breed model can be reported with different genetic base options and including or excluding heterosis. An all-breed base was calculated using the mean of all cows born in 2000. Within-breed bases were calculated from the PTA of cows whose coefficients of heterosis were <50% (i.e., F1 and backcross cows were not included). The PTA for each breed was adjusted to the within-breed base, as is done for goat evaluations and for current dairy cattle evaluations. Evaluations for crossbred animals with breed code XX will be reported on the base of the sire breed, which may cause some confusion because evaluations of animals from reciprocal crosses will be on different bases.All 3 estimates are in Table1 to provide confidence that estimated breed differences are reasonable. For PL and SCS, current estimates were more similar to phenotypic breed differences than to previous estimates. Reasons may be that previous PL estimates were based on a previous definition of PL and cows that were born before 1990.
The largest changes in PTA were for bulls and cows with pedigrees that included more than one breed, and reliabilities also increased for those animals. Gains in reliability were small for sires of crossbred cows because most already had hundreds or thousands of purebred daughters. Only 25 Jersey and Brown Swiss bulls born since 1997 had =10 crossbred daughters. Because many purebred animals have no crossbred progeny, changes in their PTA might also be explained by changes in the grouping of unknown dams and the addition of other breeds and crossbred cows to the management groups in mixed-breed herds. Those additional herd mates should increase accuracy but might also cause some bias if management of different breeds is not the same within herd.
Genetic Trend
Three trend validation tests were performed for each of 5 breeds (excluding Milking Shorthorn) and 5 traits. Interbull requires trend tests to be within 2 standard errors of 0.01 genetic standard deviations per year. Few biases were detected. For 64 of the 70 tests, 95% confidence intervals included the range of -0.01 to +0.01 genetic standard deviations per year. Trends were then converted back to within-breed scales and compared with the previous official estimates. Most changes in Holstein trends were accounted for by a coding error in the within-breed animal model that was corrected during development of the all-breed software. This affected all traits except productive life. Estimates of trends in the other breeds were also improved by proper accounting for crossbred animals that had been treated as purebred animals in the within-breed model. Most trend estimates changed by < 0.01 genetic standard deviations per year. Changes for SCS and DPR seem large relative to trends because all breeds had small SCS and DPR trends during the last 10 years. Brown Swiss had the largest changes in trends, but all new trends seem reasonable.Genetic trends for each breed and trait in the all-breed system are presented in Figures 1 to 6. To view these figures, click here.
May 2007