EU Beef Farms Report 2012: Feed Costs Up 74 per cent Since 2000
A European Commission report has revealed that beef production costs have risen faster than output. Feed costs have increased between 45 and 74 per cent over the period between the year 2000 and 2009. 6 August 2013
 3 minute read
This report provides an overview of the production costs, margins and incomes of farms specialising in beef production from 2000 to 2009.
In addition, it gives estimations of gross margins for 2010 and 2011. The analysis is based on the latest available data from the Farm Accountancy Data Network (FADN).
Farms are classified into three groups on the basis of the beef production system practised. ‘Breeders’ are farmers with suckler cows not fattening their calves, ‘breeders & fatteners’ fatten the calves born on their farms, and ‘fatteners’ purchase young male animals and then finish fattening them.
In 2009, the sample farms of specialist beef producers represented 44 per cent of the EU-27 cattle population. The results for the EU as a whole are dominated by EU-15 farms that make up between 88.1 per cent and 92.6 per cent of the total number of farms in the types of production analysed here. EU-10 farms complement them picture; there are only a few farms from EU-2.
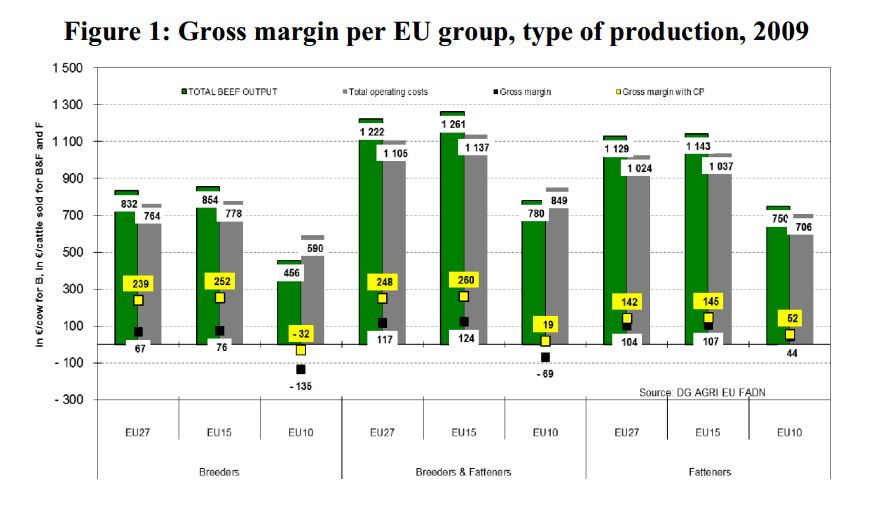
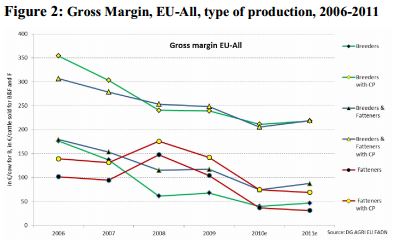
Figure 1: Gross margin per EU group, type of production, 2009Gross margins for 2009 are generally not high but, apart from EU-10, are positive for breeders and for breeders & fatteners (Figure 1). Coupled payments (CP), which have been relatively stable since 2006, helped improve the situation given that underlying margins (without CP) were low for another year (see Figure 2).
Gross margins for fatteners are lower than for breeders fatteners and for breeders expressed in terms of thenumber of males fattenedand sold per year.
This is an outcome of the specific nature of this type of beef production where the turnover of animals is much greater than for breedersand for breeders & fatteners, hence the margins per animal can be lower. However, when various indicators of income per annual work unit are taken into account, fatteners generate the highest incomes (Figure 3).
Figure 3: Income indicators per EU group, type of production, 2009
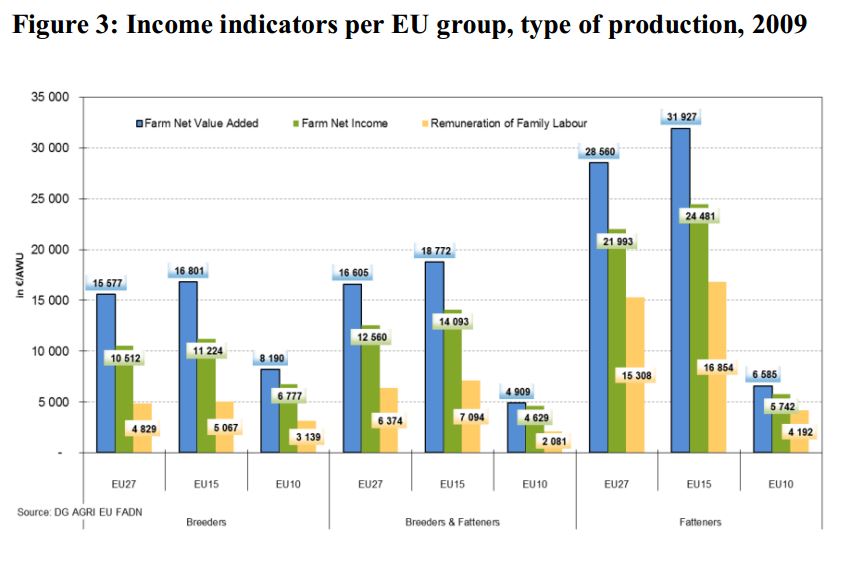
The EU-10 indicators are lower than those for EU-15 both in terms of margins and incomes, which can be explained in part by the smaller number of cows/cattle per farm, lower prices for beef and lower technical and labour efficiency.
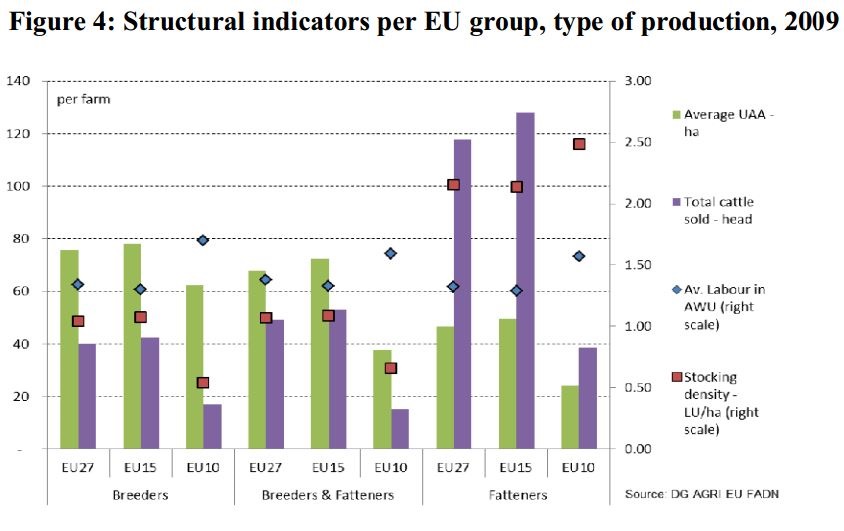
Figure 4 shows that fattening is a more intensive production type than the other two systems. Fatteners have less agricultural land, have similar labour resources but sell about three times more animals than breeders and breeders & fatteners. Stocking density for fatteners is about twice thatof breeders or of breeders & fatteners.
Three graphs in Figure 5 show that in EU-15 countries (which dominate the results for the EUas a whole and for which we have continuity of data), output went up over the period 2000-2008 but income did not necessarily do so. Only for fatteners is income growth roughly in linewith output growth.
This is a consequence of a general increase in production costs. The remarkable drop in remuneration of family labour seen in 2009 can to a large extent be explained by exceptionally high estimates of capital costs that year.
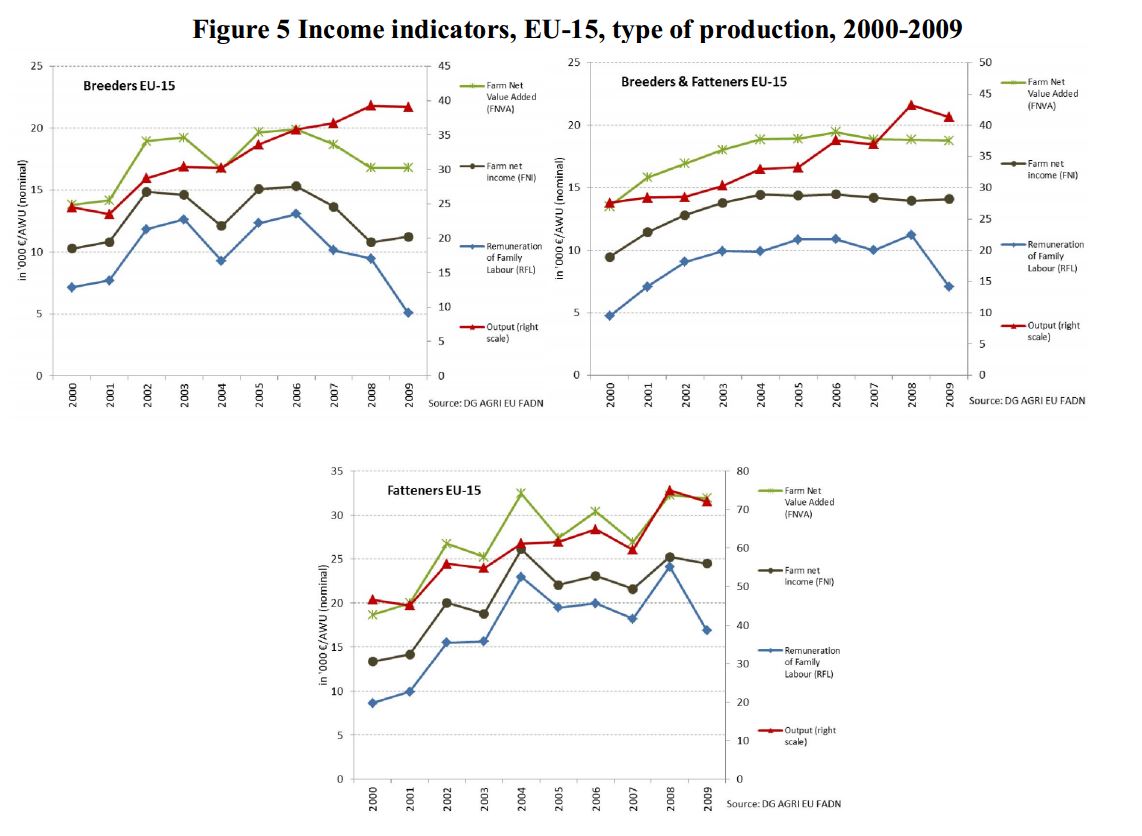
During the period under review, the main costs of beef production grew much faster than output; feed costs increased by between 45 per cent (fatteners) and 74 per cent (breeders) and animal purchase costs rose between 16 per cent and 39 per cent . In the same period output went up by between 6 and 21 per cent.
When considering developments over time, it should be kept in mind that important policy changes were made during this period. The main change was the decoupling of direct payments between 2004 and 2006. Complementary national direct payments were also decoupled in some new Member States in 2007, negatively affecting the level of gross margins, although not necessarily farm incomes.
The analysis is based on data in the EU Farm Accountancy Data Network (FADN) database. FADN brings together the results of sample surveys held each year and focuses on accountancy data from farms. The data are fairly comprehensive in terms of covering farming activities, but costs of production are recorded only as an aggregate per farm. For the calculation of margins, it was thus necessary to allocate costs to particular products.
To View The Full Report - Click Here