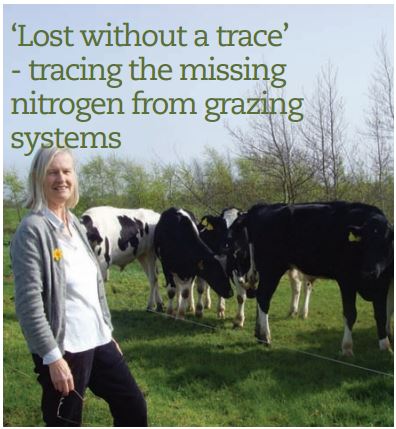
'Lost Without Trace' - Tracing the Missing Nitrogen From Grazing Systems
Dr Anne Bailey of Teagasc research discusses the impact of rapid intensification of Irish farming post-quota with specific regard to Nitrogen being lose through water and air. 30 July 2013
 3 minute read
The removal of milk quotas in 2015 is expected to lead to an increase in total dairy production in Ireland, with an associated increase in nitrogenous fertiliser usage. This may have implications for N loss to the atmosphere and groundwater. Current regulations pertaining to nitrogen management are to be reviewed in 2013 in view of the water quality targets set out in the Water Framework Directive. Anne Baily, Walsh Fellow at Teagasc – Johnstown Castle, reports on her studies, tracing the ‘missing links’ in the nitrogen cycle from a dairy farm.
Completing the Nitrogen Cycle
Efficient use of nitrogen (N) is a critical environmental as well as an agronomic issue and is subject to ongoing, worldwide, research. Most of the world’s nitrogen exists in the form of dinitrogen (N2), which is not directly available to plants. Artificially produced fertilizers and the grazing cycle can leave a residue of reactive N accumulating in the biosphere. Denitrification is an important natural process for converting reactive N back to benign atmospheric N2.
However, incomplete denitrification (where reactive N is partially denitrified to nitrous oxide gas) can lead to nutrient enrichment of a waterbody (by nitrate leaching to drainage systems or groundwater) or emissions of greenhouse gases such as nitrous oxide (N2 O) to the atmosphere. So, what are the implications for intensively grazed Grasslands in Ireland?
Losses to Air
An initial 18-month study measured and compared N2 O emissions from higher and lower grazing intensity management systems, focusing on timing, type and level of fertilizer application. Although cumulative N2O Losses from the more intensive treatment were almost twice as high as emissions from the extensive treatment, the proportion of fertilizer N lost for a complete farming year was relatively low in comparison with the few existing annual emission measurements in Ireland. The only days when N2 O emissions were high were from the second to fifth days after application of CAN fertilizer during May, June and July; after 15
N labelled nitrate enrichment, results followed a similar pattern, i.e., N2 O fluxes increased quickly but were generally below the limits of detection by day eight. It appears, therefore, that fluxes were triggered by addition of nitrate rather than ammonium fertilizer. However, during earlier applications of ammonium the weather was much cooler and the highest emissions during this study always occurred when soil temperature and water filled pore space (WFPS) were high. These data suggest that timing, type and level of fertilizer applications will
be a key to minimising N2O emissions.
A major question remained: did the relatively low level of emissions result from the ‘little and often’ fertilizer application regime, from meteorological factors or from a large proportion of fertilizer N being lost to the atmosphere as N2? A concurrent study using the 15 N gas flux method was designed to measure both N2O and N2 emissions to cast further light on this question and, as in the long-term study, to compare results between treatments over three 12-day periods in June and September 2009 and March 2010 (Baily et al., 2012). Cumulative emissions of N2
O and N2 were not significantly different between treatments but, temporally, emissions were much higher in June and September than in March. However, over each sampling period N2 cumulative emissions were much higher than
N2O emissions (by a factor of circa 5 in June and September and by a factor of circa 2.5 in March) indicating that the benign N2 was the major gaseous emission derived from this soil in generally warm, wet conditions.
Losses to water
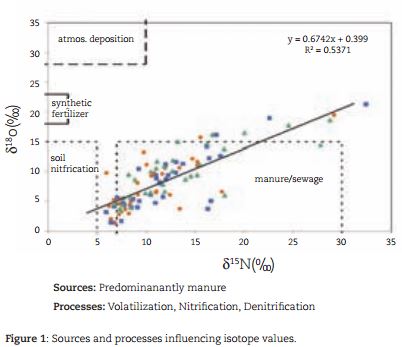
In a further study, the stable isotopes of nitrate (δ 15 N and δ 18 O) were used to investigate the source of nitrate concentrations in 28 shallow groundwater wells on the dairy farm, as well as their spatial and temporal variation (Baily et al., 2011; Fenton et al., 2011). Organically derived nitrogen was the predominant source contributing to groundwater nitrate concentrations (Figure 1). The distinct low temporal variability in the isotopic data suggested constancy in nitrate sources and processes over time across the study site. Soil heterogeneity and groundwater depth were important factors influencing the wide spatial variation in nitrate concentrations in the wells. Using the δ 15 N and δ 18 O isotopes of nitrate it was possible to see where denitrification was occurring and, in some cases, to relate this to soil type and depth. Longest vertical travel times through soil
were estimated to be up to three years for nitrate leaching from field application to groundwater. Policy makers and catchment managers should take this ‘time lag’ into account so that realistic timescales are set from inception of nitrate reduction programmes to first detection of improvements in groundwater quality – or, indeed, with
regard to potential impacts from increased intensity (Fenton et al., 2010).
Acknowledgements
Dr Anne Baily was a Teagasc Walsh Fellow from 2008-2011 at Teagasc Crops, Environment and Land Use Research Centre, Johnstown Castle. The authors gratefully acknowledge the input from Dr Catherine Watson (Agri-Food and Biosciences Institute, Belfast) and Professor Phil Jordan (University of Ulster, Colraine) as thesis supervisors, and the input from Dr Ronnie Laughlin (AgriFood and Biosciences Institute, Belfast) and Dr Luc Rock (Queen’s University, Belfast) for data analysis and interpretation.