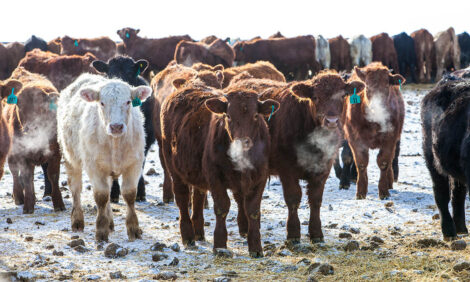


The Kindest Cut of All
Meat and Livestock Australia funded research has taken the guesswork out of which castration method delivers the best animal welfare outcomes for the northern cattle industry.Banding, rings or the knife? Which is the most humane castration method?

University of Queensland Senior Research
Fellow Carol Petherick, who recently
completed research comparing tensionbanding
with surgical castration, says
appearances are deceiving and less blood is
by no means a guarantee of less pain or less
risk of infection. Carol said the research
clearly showed tension-banding castration
is an inferior option to surgery for the
northern beef cattle industry.
“Castration is one of the most common
procedures carried out in the beef industry.
From a marketing perspective tensionbanded
castration is promoted as producing
superior welfare and production outcomes
compared to other castration methods,
particularly for older bulls,” she said.
“However, our research shows this is
perception, not fact.”

Three months post-castration, researchers found there were no weight or production differences between the two methods.
Research Approach
Carol, along with a team from CSIRO, New
Zealand’s Massey University and the
Queensland Government, compared the
welfare outcomes of tension banding versus
surgical castration on two age groups of
Brahman bulls: weaners (seven to 10 months
old) and older bulls (22 to 25 months old).
Pain was assessed by measuring blood
cortisol levels (a hormone activated by
stress) and by recording the animals’
behaviour. Wounds were also assigned a
score to help monitor post-castration
healing and recovery.
“We found banding caused less pain and
discomfort than surgical castration during
the procedures,” Carol said. “However,
during the next 1.5 hours, banded bulls
from both age groups experienced greater
pain and stress than the surgically
castrated bulls.”

Relief
Carol said ketoprofen (a non-steroidal
anti-inflammatory) helped alleviate pain in
the surgically castrated mature bulls (mostly
between 1.5 and three hours afterwards) but
not in the mature banded bulls.
“Ketoprofen made little difference to the
weaner groups, they all recorded high
cortisol concentrations but we believe this
was because the mature bulls were all quiet
and accustomed to being handled while the
weaners were not, and the cortisol response
to pain was masked by their stress response
to being handled and restrained,” she said.
Two to four weeks post-castration the
mature banded bulls were still showing
elevated cortisol compared to the surgical
castrates, while haptoglobin concentrations
(an indicator of inflammation) were
significantly high in all banded cattle.
Kilos and Costs – The Profit Drivers
The simple philosophy of the groups
is based on establishing two figures –
the kilograms of meat produced
and the costs of producing that meat.
Facilitator Bill Hoffman, of Hoffman Beef
Consulting, said each group addresses
unique production and profit issues at
quarterly meetings, but at their core is a
strong focus on measuring and monitoring
business health through annually
calculating the kilograms and the costs.
Located at Guyra, Ebor, Yarrowitch, Baryulgil,
Northern Rivers and in the North West, the
groups involve 72 producers who collectively
manage 79,900 cattle, conservatively
valued at $63.9 million, across 119,850ha.
“The most profitable beef producers do not
necessarily have the lowest cost of
production (CoP), but they have it under
control, it’s relatively low, and importantly,
they’re using the figure to improve their
beef enterprise,” Bill said.
Most of the groups have been calculating
CoP for a number of years, which has
enabled Bill to develop indicative regional
benchmarks for different beef operations in
various locations.
Comparing CoPs
Within the six groups there is a wide range
of CoP each year from $0.79/kg to $3.92/kg.
Each year there are outliers (notably
different figures from the bulk of the data)
for a range of reasons, but the median
2010-11 CoP across the Ebor, Guyra and
Yarrowitch groups was $1.22/kg.
“The benefit of having six beef profit groups
with the same facilitator is we can compare
the CoP within the group, and across the
groups, because it was calculated in the
same way,” Bill said.
“In the early days the group environment
offers support and confidence in calculating
CoP. Over time the capacity is built within
the individual members so that if the group
was to dissolve, producers would continue to calculate their CoP individually as a
measure of business health.”
Bill emphasised any form of benchmarking
needs to be approached with caution.
“Benchmarking an individual business
year-to-year with itself gives the most
informed view of where the business is
going. A high CoP in one year may indicate
one off events such as major pasture
renovation or significant repairs and
maintenance so it is important to look at the
trend over a minimum of three years,
preferably five,” Bill said.
“To date we have kept the process simple as
that is what group members tell me they
want. We focus on the operational level of
the business and a small number of Key
Performance Indicators that are strongly
collated with profit and I am sure that has
strong flow on benefits to overall profit.”
CoP and kilograms of beef produced
are strong indicators of profit. Between
2008–09 and 2010–11 CoP has fallen by
$0.33/kg and kilos of beef produced
has risen by 14,896kgs across the three
NSW northern tablelands Beef Profit
Network groups.
“In 2010–11 86% of the members would have
achieved a positive operating margin in
$/kgs of beef they produced and that is a
pleasing result,” Bill said.
Average Cost of Production (/kg) and Total Kilograms of Beef Produced over three years for Six Beef Profit Groups.

Measuring Greener Pastures
Southern Australia’s first pasture audit
in 17 years has found pasture varieties
and their condition have changed
dramatically in the past two decades.
Analyst Graham Donald, who also worked
on southern Australia’s first pasture audit in
1994, observed the effect of prolonged
drought and the tightening economic
situation for many producers has had an
impact on pastures.
“The audit showed 30% of southern
Australia’s pastures are in decline and
there has also been a substantial
change in pasture composition which
reflects the huge shift in the way
farmers do business,” Graham said.
He explained one of the biggest changes was
an increase in the variety of pasture cultivars and the large-scale adoption of fodder or
dual-purpose crops, reflecting a drive for
increased enterprise flexibility as producers
hedge their bets against climatic challenges.
State Trends
The audit, funded by MLA, found the area
planted to lucerne in NSW, Victoria, Tasmania,
South Australia and south Western
Australia had risen considerably while
Tasmania also had increased plantings of
cocksfoot. South Australia had more fescue
and burr medic and in Western Australia,
there were more plantings of serradella.
Conversely balansa clover plantings had
substantially reduced.
“This could mean it was oversold in the ‘90s
or just didn’t have the persistence producers
wanted,” Graham said. “The recent perturbed climate events following a period of extended
drought may affect the sustainability and
persistence of some pastures.”
Research Direction
MLA Manager, Environmental and Natural
Resource Management, Cameron Allan said
the results of the audit will provide input to
the $27 million Feedbase Investment Plan
and also ensure a maximum return on
producer levies by helping to identify the
best R&D opportunities.
“A defendable case is required for investment
decisions and historically, pasture-related
information generally available is now
insufficient – it lacks detail,” he said. “This
audit has gathered opinions from local experts
about the mix of pastures in their locality.
“Many pieces of data are combined to build a
case including ABAREs statistics, volume of
seed sold and local evidence but it still
leaves us with an incomplete
understanding of the feedbase that
supports our livestock industries.”
Cameron said this unique snapshot of
pasture composition and condition had
enormous potential.
“We hope to create a living database where
this information can be more regularly
updated and provide valuable support and
sound justification for investment decisions
made by the public and private sectors,”
he said.
“It could also be used to update producer
tools such as the website www.
pasturepicker.com.au”
Cameron said the next step is to work with
public agencies and the private sector to see
how this information can best be used to
support industry.
A Map Illustrating Subclover Distribution Across Australia.

Source CSIRO.
January 2013


