


Florida and the Dairy Industry
There are four areas most dairy farmers are interested in: milk price, milk sales, milk production, and dairy policy. Calvin Covington, former CEO with Southeast Milk Inc looks at these four areas for the Florida dairy industry. 3 July 2012
 5 minute read
Milk Price
Many factors determine the price a dairy farmer receives for their milk production. Two key factors are the Federal Order blend price and the over-order premium. Table 1 for the years 2004-2011, shows the blend price and charged over-order premium for the Florida Federal Milk Marketing Order. The blend price and charged over-order premium, combined, is the average price a regulated milk buyer pays for milk in the Florida order.
Table 1. Florida Federal Order Blend Price (Tampa) and Charged Over-order Premium (OOP) 2004-2011
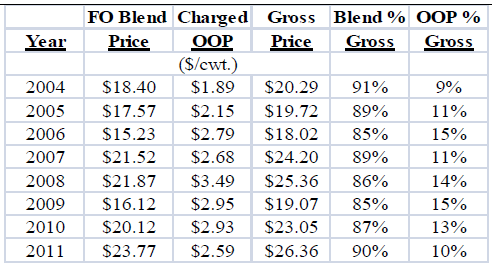
Data Source: Agricultural Marketing Service and Florida Federal Milk Market Administrator
Generally, when the blend price is low (2006 and 2009) the charged over-order premium is a higher
percent of the gross price. On the other hand, when the blend price is high (2011), the over-order
premium is a smaller percent of the gross price. In 2011, 90% of the gross price was determined by
the Federal Order blend price and 10% from the over-order premium.
The level of over-order premium is dependent upon the price of raw or packaged milk in “available
areas”, plus the transportation cost to ship the raw or packaged milk to the Florida market.
The Federal Order blend price is the weighted average of how milk is utilized in four classes. The
classes are: Class I (fluid), Class II (soft manufactured products such as cottage cheese, ice cream,
yogurt), Class III (hard cheese), and Class IV (butter and powder). The prices of four dairy commodities – cheese, butter, dry whey, and nonfat dry milk powder are the basis of determining
the prices of all four classes. In addition, differentials are added to the Class I and II prices.
An analysis was conducted of the Florida Federal Order pool for 2009, 2010, and 2011 to determine
the weight of each of the above factors in determining the blend price. Table 2 shows the results.
Table 2. Weight of dairy commodities and differentials in calculating the Florida Federal Order blend price 2009-2011
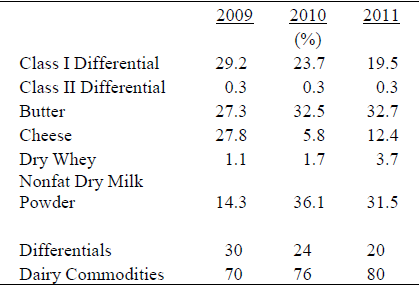
Data Source: Florida Federal Milk Market Administrator
Even in a fluid milk market, such as Florida, the majority of the blend price is determined by the price of four dairy commodities – cheese, butter, dry whey, and nonfat dry milk powder. Supply and demand, both domestic and international, determines the price of those four commodities, thus the majority of the blend price.
Milk Sales
Table 3 shows fluid milk sales in the Florida Federal Order and the U.S. Nationwide, less fluid milk
is sold today than in 2000, even though the U.S. has about 30 million more people in 2011
compared to 2000. Florida fluid sales were higher in 2011 than in 2000, mainly due to significant
increases in populations. 2011 was a sluggish year for milk sales, both in Florida and the U.S.,
down 2.6% and 1.8%, respectively.
Even though fluid milk sales have increased in Florida since 2000, the increase has come from milk
packaged by plants not physically located in the Florida order. Sales from in the marketing area
(plants physically located in the Florida order) have stayed relatively flat as shown in Figure 1.
Table 3. Florida and U.S. fluid milk sales and U.S. per capita consumption 2000, 2005, 2010, 2011
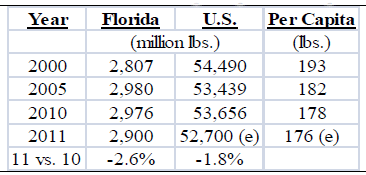
Data Source: Florida Federal Milk Market Administrator, Agricultural Marketing Service, International Dairy Foods Association, and own estimates
Florida Fluid Milk Total Sales and in Area Sales, 2000-2011. Data Source: Florida Federal Milk Market Administrator
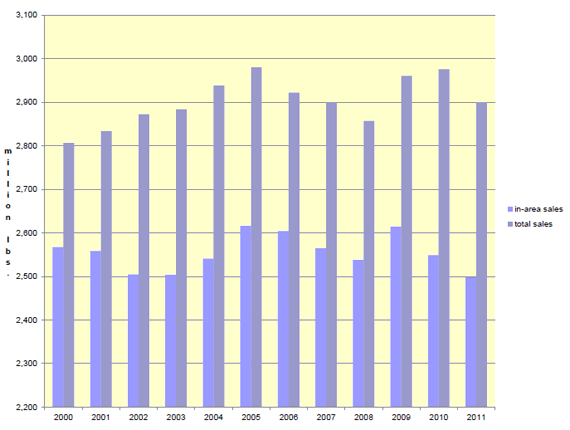
In 2000, only 8.53% of Florida sales were from plants outside of the Florida order. In 2011, the percent increased to 13.87%. Much of this increase is from organic fluid milk sales as seen in Table 4. No organic milk is packaged in Florida.
Table 4. Florida fluid milk sales by product.
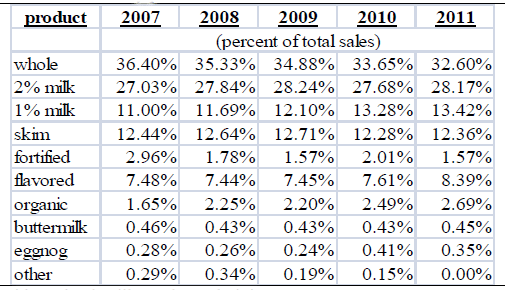
Data Source: Florida Federal Milk Market Administrator
Both the Florida and U.S. fluid sector is dividing up the same size pie. This is not healthy for dairy farmers, processors, and consumers. If per capita consumption of fluid milk was the same today as in 2000, fluid would utilize an additional 5 billion lbs. of milk, annually.
Milk Production
Milk production in Florida peaked in 1990 at about 2.5 billion lbs. as seen in Table 5. Florida milk production in 2011 increased a strong 6.7% from 2010. Florida is the dominant milk producing state in the southeast, producing 25% of total southeast milk production.
Table 5. Florida, Southeast, and U.S. Milk Production 1950-2011.
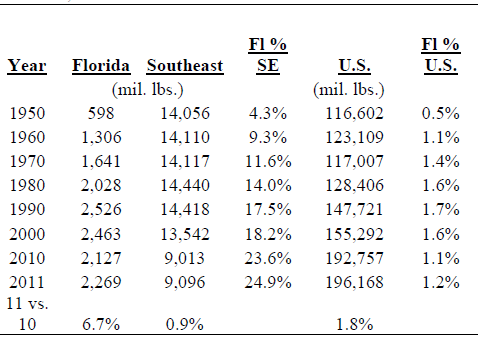
Data Source: National Agricultural Statistics Service
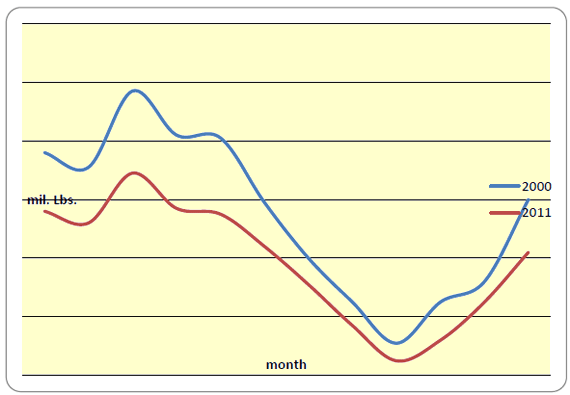
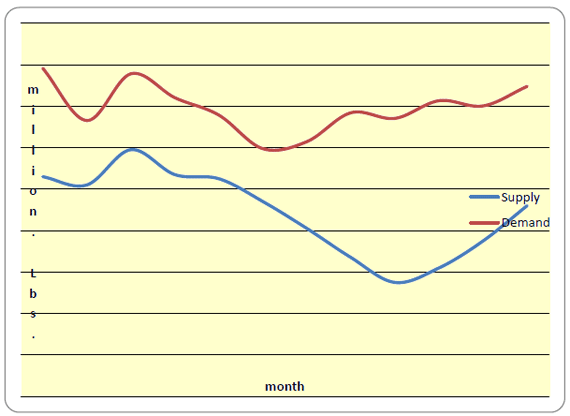
Seasonality of milk production is a challenge in the Florida market. However, as shown in Figure 2, the difference between the highest milk producing month (March) and the lowest (September) is decreasing. The difference between these two months was 86 million lbs. in 2000, but declined to 64 million lbs. in 2011. Demand for fluid milk is greater than milk supply in Florida each month of the year as depicted in Figure 3.
Florida Milk Production by Month 2000 and 2011. Data Source: National Agricultural Statistics Service
Florida Milk Supply Versus Milk Demand by Month 2011. Data Source: National Agricultural Statistics Service and Florida Federal Milk Market Administrator
Dairy Policy
The following is a list of dairy legislation now pending in the U.S. House and Senate:
- Dairy Security Act of 2011
- Federal Milk Marketing Improvement Act of 2011
- Dairy Advancement Act of 2011
- Dairy Producer Income Protection Act of 2011
- Dairy Pricing Reform and Farmer Protection Act of 2011
- Rural Economic Farm and Ranch Sustainability and Hunger Act of 2011
- MILC Preservation Act of 2011
- MILC Continuation Act
A major challenge for future Federal dairy programs is money. According to information released
by the House of Representatives Subcommittee for Dairy and Livestock, $5.98 billion was spent on
dairy programs from FY02-FY11. Of this amount $3.65 billion was spent on the Milk Income
Loss Contract Program and $2.16 billion for the Dairy Product Price Support Program. For the next
ten years, FY12-FY21, the Congressional Budget Office baseline for dairy programs is $450
million.
My suggested priorities for Federal dairy policy as it pertains to Florida are:
- Make sure the cure is not worse than the disease. No new dairy legislation is preferable, if proposed programs worsen the situation, do not increase milk sales or dairy farmer income, or the outcome of the proposed legislation is uncertain.
- Spend resources on improving current Federal programs to better benefit dairy farmers. And, terminate existing programs that increase dairy farmer costs.
- Increase fluid milk sales - one of the best ways to increase income for all dairy farmers.
- Defend the Federal Order system. Federal Orders level the playing field among producers, cooperatives, and processors. Orders decrease price volatility, strengthen producer milk prices, and promote more orderly marketing. Orders are one government program that provides a return on investment (government outlay $5.5 million/year past 10 years).
- Maximize the economic and political resources available.
July 2012

 13 June 2026
21
minute read
13 June 2026
21
minute read