Dairy Situation and Outlook - October 2009
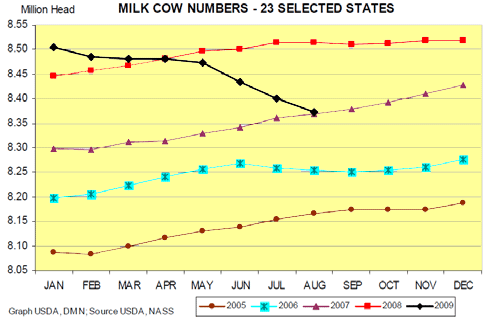
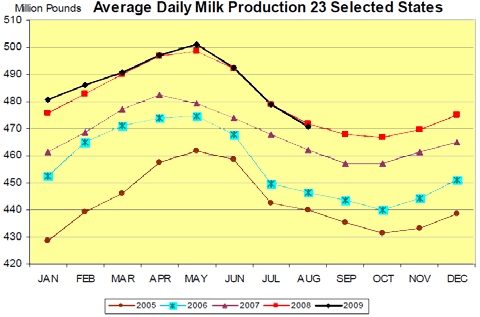
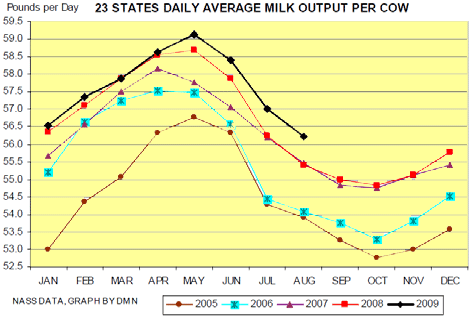
In August 2009, milk production from 23 major dairy states decreased 0.2 per cent, writes Robert Tigner from University of Nebraska Extension. 24 October 2009
 4 minute read

Production per cow was up by 25 pounds from one year ago. Milk cow numbers were 143,000 less than August 08 and 28,000 less than July 09. July 2009 milk production was revised down 0.1 per cent, a decrease of 13 million pounds.
In Iowa, August 2009 milk production was 2.52 per cent higher than one year ago. Cow numbers were even compared to one year ago and milk production per cow was 40 pounds higher than one year ago. August 2009, in Iowa cheese production was down by 4.374 million pounds, 32.7 per cent higher than one year ago and 573,000 pounds, -3.1 per cent less than July 2009. Of the individually reported states, this may mean Iowa is the eighth largest cheese producing state.
| Milk Production: Selected Dairy States, August 2009 | |||||||||
| thousands | thousands | pounds | pounds | million pounds 2008 | million pounds 2009 | ||||
|---|---|---|---|---|---|---|---|---|---|
| State | 2008 cow numbers | 2009 cow numbers | percent change | 2008milk per cow | 2009milk per cow | percent change | total milk production | total milk production | percent change total milk |
| Iowa | 215 | 215 | 0.00% | 1660 | 1700 | 2.41% | 357 | 366 | 2.52% |
| MN | 465 | 469 | 0.86% | 1565 | 1620 | 3.51% | 728 | 760 | 4.40% |
| WI | 1252 | 1257 | 0.40% | 1650 | 1705 | 3.33% | 2066 | 2143 | 3.73% |
| IL | 102 | 102 | 0.00% | 1455 | 1530 | 5.15% | 148 | 156 | 5.41% |
| CA | 1846 | 1782 | -3.47% | 1840 | 1820 | -1.09% | 3397 | 3243 | -4.53% |
| CO | 130 | 123 | -5.38% | 1930 | 1980 | 2.59% | 251 | 244 | -2.79% |
| KS | 117 | 116 | -0.85% | 1710 | 1725 | 0.88% | 200 | 200 | 0.00% |
| ID | 555 | 548 | -1.26% | 1970 | 1940 | -1.52% | 1093 | 1063 | -2.74% |
| NM | 337 | 320 | -5.04% | 1920 | 2000 | 4.17% | 647 | 640 | -1.08% |
| PA | 548 | 545 | -0.55% | 1590 | 1610 | 1.26% | 871 | 877 | 0.69% |
| NY | 626 | 618 | -1.28% | 1690 | 1715 | 1.48% | 1058 | 1060 | 0.19% |
| TX | 425 | 420 | -1.18% | 1605 | 1680 | 4.67% | 682 | 706 | 3.52% |
| 23-State | 8515 | 8372 | -1.68% | 1718 | 1743 | 1.46% | 14626 | 14594 | -0.22% |
| US 2nd quarter | 9315 | 9262 | -0.57% | 48774 | 48262 | -1.05% | |||
California milk production has suffered through 2009, it has been lower than during 2008. And milk production per cow has averaged 20 pounds less.
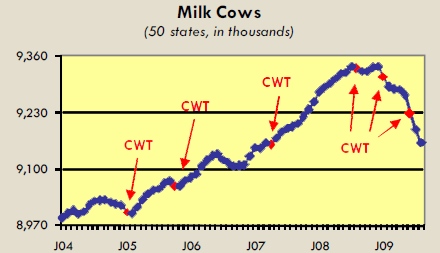
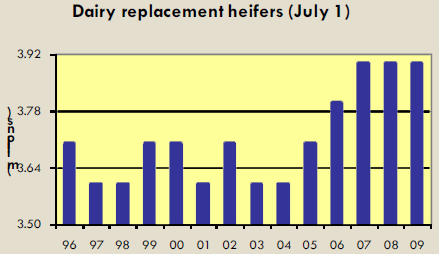
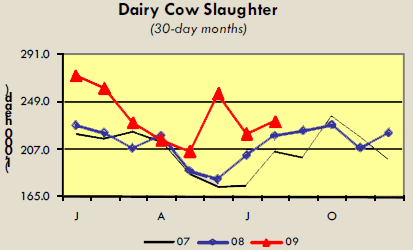
Dairy producers sent 238,900 dairy cattle to slaughter in August. This is up from one year ago and the previous month. However, total milk production has been offset by a large volume of replacement heifers in the pipeline. Dairymen had 3.9 million dairy replacements on hand in July, the same number as in 2007 and 2008, according to the biannual “Cattle” report. This matches the highest figure of the last 15 years (see chart). There were 42.4 replacements for every 100 cows in the herd, up from 41.7 per 100 last year. The previous three sentences are repeated from last months’ outlook as a reminder that we see the same strong milk production response relative to cow numbers for a few more months.
Demand or Disappearance
August total cheese output was 849.531 million pounds, up 1 per cent from one year ago and 2.6 per cent more than July 2009. California cheese production was -2.4 per cent, ID +2.2 per cent compared to one year ago. Wisconsin cheese production was +8.2 per cent from one year ago but 2.4 per cent from July 2009. Italian type cheese production totaled 349.78 million pounds, 0.1 per cent above July 2009 and 3.9 per cent more than one August 2009. American type cheese production totaled 345.243 million pounds, 1.6 per cent below August 2008 and -2 per cent from July 2009. Butter production was 100.18 million pounds, 13.6 per cent below Aug 2008 and 12.3 per cent below July 2009.
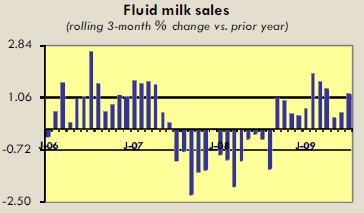
Fluid milk sales continue to be in positive territory compared to one year ago. Year to date (January-July) fluid milk disappearance is up 1.4 per cent. The May-July period is up by 1.3 per cent Total commercial disappearance year to date was down by 0.6 per cent but last year’s same period had a rise of 3 per cent. Butter was -3.7 per cent and nonfat dry milk was -7.5 per cent. American cheese was up 4.3 per cent and other cheese up 1.4 per cent.
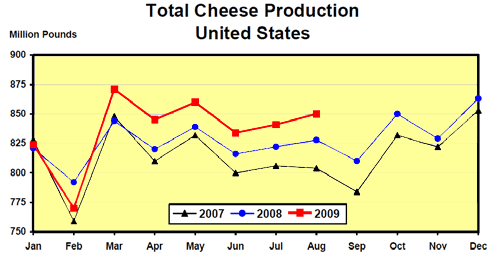
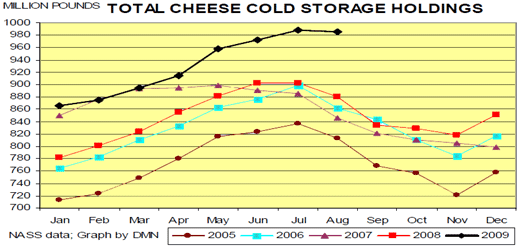
Recent cheese production has continued to be high. But cheese stocks seem to be leveling off and that is to be expected at this time of year. But the 6.8 million pound decline in August was the smallest drop for that month since 1992. So we continue to be near the highest storage total since August 1985.
Commercial butter inventories increased in August for the first time since 1990. August stocks on average declined by 29.4 million pounds in the past 10 years. This August butter stocks expanded by 391,000 pounds.
Analysis
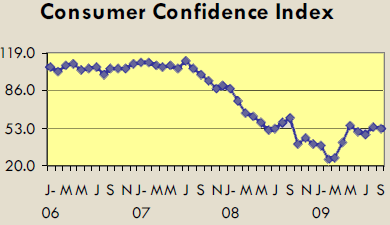
The Consumer Confidence Index reported for September declined to 53.1 after an August increase. Consumers apparently viewed business conditions and employment prospects less positively. Income growth also is not expected to grow according to consumers.
The large numbers of dairy replacements may have contributed to the weak decline in total milk production by moving into spots older cows had taken. These higher quality dairy cattle will likely continue to pressure further dairy slaughter. In fact on 1 October 2009, CWT announced third herd retirement for 2009 obviously recognizing that further herd reduction is necessary for milk prices to rise.
Ed Jesse, professor emeritus University of Wisconsin commented on the 2008 loss of export markets, 5.7 billion pounds of milk equivalent. Through June milk production was off only 195 million pounds. Some wonder why milk production adjustment is taking so long. Reasons include MILC and the ability of some dairy farmers to withstand losses through cash reserves or borrowing. Who will be the last producer standing?
October 2009