Purdue dashboard reveals weaknesses in US food supply chain
The meat industry received the lowest diversity score 5 January 2022
 2 minute read
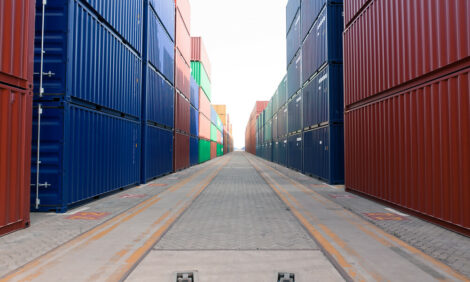
Bare shelves this holiday season highlight shortages and show how vulnerable the supply chain can be to disruptions. Purdue University developed an interactive dashboard that characterises the vulnerability of input purchases for each food industry within each US state.
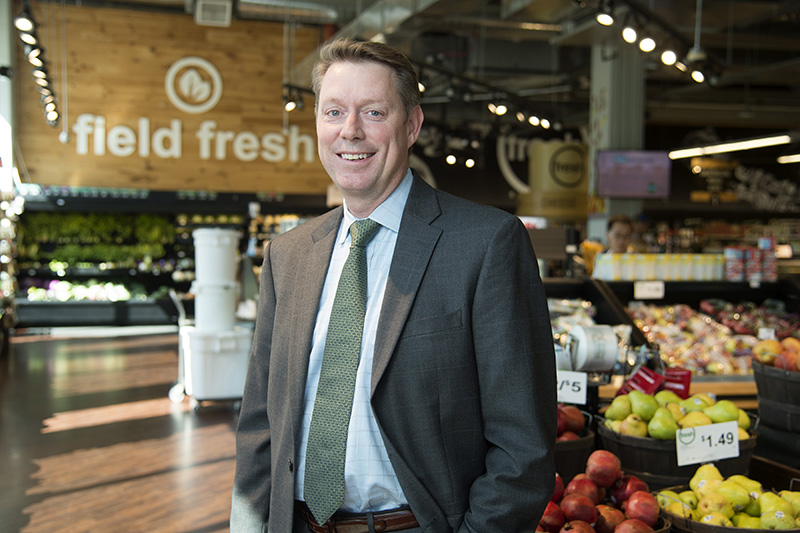
“We call the exposure to labor and upstream industries the Achilles’ heel of the supply chain,” said Jayson Lusk, an internationally recognised food and agricultural economist and distinguished professor and department head of agricultural economics at Purdue University.
“If a key link is weakened, it impacts the strength of the entire chain. Our research identified the most vulnerable points and it also highlights the importance of diversifying," Lusk said in an interview with Purdue Agricultural Communications. "If multiple suppliers of needed inputs are used, it is like doubling up links at critical points in the chain.”
Lusk, who leads Purdue’s Center for Food Demand Analysis and Sustainability, and Ahmad Zia Wahdat, a postdoctoral research associate at the centre, developed an interactive dashboard to share their findings. A working paper posted on SSRN details their work.
The dashboard teases out the inputs needed for different food industries, provides the share of total cost of upstream inputs and labour, and evaluates the risk of an industry based on a diversity score. The score ranges from a value of zero to one, with higher scores indicating less vulnerability.
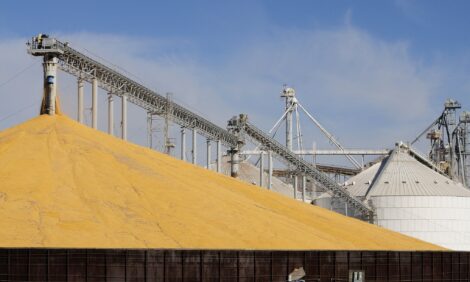
“The meat industry had the lowest diversity score,” Wahdat said. “Around $163 billion worth of input purchases are exposed to upstream industries and labour. Of this, animal production, or farms, and labour across production and transportation are the dominant sources of vulnerability. So, events like a pandemic, natural disaster or animal illness can jeopardize the output of the meat industry, as we have seen.”
For example, if 10% of input supply for this industry were lost, it would lose an average of $203 million of its output for each state across the nation. And if 10% of production labour within the industry was lost, $28 million in output for each state would be lost, Wahdat said.
“Four major meat processing companies process 85% of cattle in the US,” Lusk said. “If these processing plants are hit with a disaster, there will be shortages of beef in grocery stores.”
The dashboard provides information for the entire US as well as state by state.
“We see this information being used by policymakers and industry executives,” Lusk said. “By seeing where there are potential vulnerabilities, they can work to protect input supplies by diversifying their input purchases across multiple suppliers or developing contingency plans."
"A grocery store buyer may compare the diversity scores of the states from which they buy a product, or perhaps those within a given industry would look to states with high scores and choose to adopt some of their practices," he added.
The dashboards are part of a portfolio of public dashboards created through Purdue’s Center for Food Demand Analysis and Sustainability, which is part of Purdue’s Next Moves in agriculture and food systems.