In The Cattle Markets
US - A weekly review of the cattle market by Darrell R. Mark, Ph.D., Assoc. Professor, Department of Agricultural Economics, University of Nebraska–Lincoln. 2 July 2010
 8 minute read
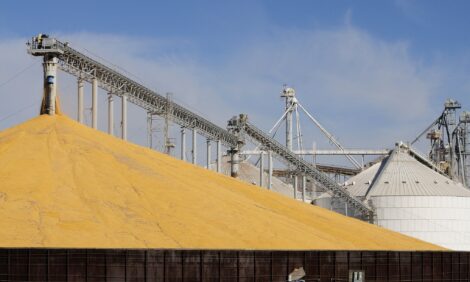
Corn Acres Drop; Disappearance Increases
On June 30, 2010, USDA released both the June Acreage Report and the June Grain Stocks report. Overall, acreage planted in 2010 to the 21 principal crops was estimated at 318.9 million acres, down 360,000 acres from 2009. Corn planted acreage, at 87.872 million acres, was 1.6 per cent higher than in 2009. However, the average trade expectations leading into the report was for an increase of about three per cent, to 89.229 million acres. With pre-release estimates ranging from 88.1 to 90.153 million acres, USDA’s lower corn planted acreage is bullishly surprising to the market. Muc h of the trade expected a higher corn acreage number based on early corn planting progress and the March 31st planting intentions reported at 88.8 million acres. Ultimately, though, it appears corn growers elected to plant about 928,000 fewer acres to corn than they intended to last spring. Despite early planting in April, excess moisture conditions in mid-May limited some later corn plantings. Additionally, high corn input costs and a corn-soybean ratio that favored soybeans likely caused some growers to shift acres to soybeans. In fact, soybean planted acres for 2010 are estimated at an all-time record high 78.868 million acres. This is 1.8 per cent higher than the 2009 soybean acreage and 800,000 more acres than growers indicated they planned to plant in the March 31st Planting Intentions Report. The soybean planted acreage is also at the high end of the trade’s pre-release estimates, ranging from 76.528 to 78.9 million acreages. So, with an average expectation at 78.183 million acres, the higher soybean planted acreage figure will be construed bearishly by the market. However, bearishness of that number will likely be overridden by the bullish corn acreage report and the bullish corn and soybeans stocks numbers also reported on June 30th.
The quarterly Grain Stocks Report showed June 1 corn stocks in commercial and noncommercial storage at 4.31 billion bushels. This was about 288 million bushels less than the average trade pre-release estimate. It implies a usage of about 3.38 billion bushels from March through May, up about 25 per cent from the March-May disappearance in 2009. Ramping up of ethanol use has contributed to this increased corn use. June 1 soybean stocks were also lower than expected. At 571 million bushels, the actual stocks were 23 million bushels lower than expected.
The bullish reports resulted in corn opening $0.30/bu higher (the daily limit) on the CME on Wednesday morning and soybeans were $0.14-0.24/bu higher on the open. Prices did begin to back off, particularly for beans, within the first hour of trade. Today’s reports leave livestock producers with less certainty regarding feed input prices and the prospects of paying higher prices. Prior to the reports’ release on Wednesday, nearby corn futures had dropped about $0.40/bu in the last week and a little more than $1/bu since the January 2010 highs. While some livestock producers may have taken advantage of the recent lows to lock in additional feed needs, it is likely that many did not given the consistent, recent downtrend in corn prices. So, is it “too late” for livestock producers to lock in feed needs, or will there still be some opportunities? There are both bullish and bearish factors to consider. Amongst the bullish factors that could keep driving corn prices higher are the lower-than-expected acres and higher usage rates. Today’s report effectively drops both the old crop and new crop carryover from the 1.6 and 1.573 billion bushels, respectively, USDA projected in June to likely less than 1.4 billion bushels. While those estimates will not be available until USDA’s July WASDE report on July 9, it is possible that the stocks-to-use ratio will tighten to the 10- 11 per cent range, which would signal higher prices. Another bullish factor is the slight downturn in crop condition ratings in the past week. While the overall condition rating has been well above average in 2010, the amount of the crop rated good to excellent saw its first decline (of two percentage points) this past week. Likely, this drop is a reflection of flooding and hail damage to corn in the Western Corn Belt in the past couple of weeks. A third bullish factor for livestock producers to consider is the potential for EPA to increase the ethanol blend rate. While delayed for several months, it appears an announcement of a move to E12 or E15 could occur this fall. Another factor to watch through the remainder of the summer is a potential shift in weather pattern from El Nino to La Nina. Dr. Elwynn Taylor, Iowa State University Climatologist, has indicated that the last 30 days has seen a dramatic shift towards La Nina, which brings hot, dry weather conditions to the Midwest grain belt. Should that occur during key pollination and kernel filling stages in July and August, corn prices will likely increase.
There are several bearish corn market factors that could work in livestock producers’ favor as well. First, the corn acreage, though smaller than expected, is still the second largest corn planted acreage in decades (surpassed only by 2007). Additionally, USDA’s current trendline yield forecast of 163.5 bu/acre is viewed as conservative by many crop analysts given the early planting date and excellent crop condition. Still, if realised, it would be the second highest-ever corn yield. Thus, it is quite possible to harvest the largest corn crop in history in 2010. Second, some aspects of demand are questionable, even though overall corn demand has been growing. Both cattle and hog industries continue to see contraction, thereby reducing their feed usage. Additionally, tighter margins in recent weeks for ethanol producers and the prospect of an expansion to only E12 instead of the expected E15 will limit corn demand in that industry. Finally, outside market influence (e.g., energy prices, stock market, and currencies) have not been particularly supportive to corn prices.
This all suggests that livestock producers still have opportunities to lock in corn needs; however, the market environment is dramatically different than it was prior to the reports on Wednesday morning. Now, buying cash corn on price dips and a weak basis to hedge a portion of third and fourth quarter feed needs seems appropriate. Additionally, purchasing call options to establish a ceiling price is a strategy to consider. A less expensive option strategy would be to purchase call options and simultaneously sell put options with a higher strike price to create a “purchase” window, or fence.
Another possibility is to consider other feedstuffs in place of corn. In the past month or two, the wheat-to-corn price spread has created an incentive for some feeders to bring wheat into feedlot rations, particularly in the Southern Plains where low-protein wheat has been plentiful. Additionally, today’s acreage report was bearish for the wheat market as well. USDA reported all wheat planted acreage for 2010 was 54.3 million acres, which was 480,000 acres more than what the trade expected. Further, June 1 wheat stocks, at 973 million bushels, were about 33 million bushels more than expected. While Southern Plains feeders may look towards wheat as an alternative to corn, Northern Plains feeders will likely look towards corn milling coproducts, especially distillers grains and gluten feed. Currently, wet distillers grains are trading at about 60 per cent of the price of corn (measured on a dry matter basis) and dried distillers grains are about 75 per cent of the corn price. One additional note of caution for Northern Plains feeders in Iowa, Nebraska, and South Dakota: these three states saw the largest declines in corn acreage relative to last year. Thus, local supplies of corn grain are likely to be smaller this year and basis will likely strengthen with smaller local supplies and stronger local demand from both ethanol production and additional cattle on feed in those states.
The Markets
During active trade on Wednesday of last week, the bulk of the fed cattle trade occurred at prices mostly steady with the previous week following the June 18 release of a mostly neutral USDA Cattle on Feed Report. The 5-Area fed steer price averaged $90.99/cwt on a live basis and $146.08/cwt on a dressed basis. Some cattle qualifying for Quality System Assessment (QSA) programs earned premiums of $10-15/head. Last week’s boxed beef prices averaged $0.79/cwt higher than the previous week, with Choice boxed beef at $154.5/cwt. The Choice- Select spread continued to seasonally widen last week as well to $8.25/cwt. Lower feed costs lead to an advance in the feeder cattle market last week. Yearling steer prices in Oklahoma were $1.64/cwt higher than the previous week and over $13/cwt higher than last year. Steer calf prices in Oklahoma were up more than $4/cwt, while Nebraska steer calf prices jumped more than $6/cwt. The $0.14/bu drop in corn prices through Thursday last week contributed to the strength in feeder cattle prices. Distillers grain prices also lost about $2/ton last week. Dried distillers grains plus solubles (DDGS) were priced at about 75 per cent of the corn price (on a dry matter basis) in Nebraska, while wet distillers grains plus solubles (WDGS) were 60 per cent of corn price (dry matter basis).
|
Cattle or Meat Category
Data Source: USDA AMS Market News
|
Week of
6/25/10 |
Week of
06/18/10 |
Week of
06/26/09 |
|
|---|---|---|---|---|
| 5-Area Fed Steer | all grades, live weight, $/cwt | $90.99 | $91.02 | $81.54 |
| all grades, dressed weight, $/cwt | $146.08 | $145.89 | $129.43 | |
| Boxed Beef | Choice Price, 600-900 lb., $/cwt | $154.50 | $153.70 | $139.71 |
| Choice-Select Spread, $/cwt | $8.25 | $7.54 | $7.25 | |
| 700-800 lb. Feeder Steer Price | Montana 3-market average, $/cwt | - | - | - |
| Nebraska 7-market average, $/cwt | $119.86 | - | $105.32 | |
| Oklahoma 8-market average, $/cwt | $113.62 | $111.98 | $99.94 | |
| 500-600 lb. Feeder Steer Price | Montana 3-market average, $/cwt | - | - | - |
| Nebraska 7-market average, $/cwt | $136.24 | $130.05 | $121.56 | |
| Oklahoma 8-market average, $/cwt | $126.75 | $122.34 | $107.89 | |
| Feed Grains | Corn, Omaha, NE, $/bu (Thursday) | $3.30 | $3.43 | $3.60 |
| DDGS Price, Nebraska, $/ton | $92.80 | $95.05 | $130.25 | |
| WDGS Price, Nebraska, $/ton | $29.00 | $31.60 | $46.34 | |