


World Agricultural Supply and Demand Estimates - December 2008
Overall meat production forecasts in the US have been lowered compared to last month, according to the latest World Agricultural Supply and Demand Estimates (WASDE) from the United States Department of Agriculture. 8 December 2008
 13 minute read

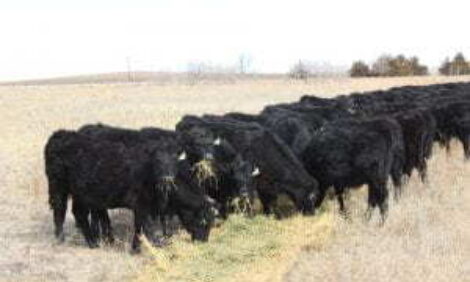
LIVESTOCK, POULTRY, AND DAIRY: Total US meat production forecasts for 2008 and 2009 are reduced from last month. Forecasts for 2008 for all meats are lowered, reflecting a slowdown in output during the fourth quarter to date. The pork production forecast for 2009 is raised as lower feed costs result in slightly heavier weights, but this gain is more than offset by lower forecasts of beef and poultry. Cattle placements for the remainder of 2008 are expected to be lower which will result in reduced beef production in the first half of 2009. Poultry production is forecast lower as poor returns are expected to result in a continuation of production declines for the first part of 2009. Lower feed prices and higher broiler and turkey prices may stabilize production in the latter part of the year.
Export forecasts for beef are little changed from last month, reflecting actual third-quarter data. Pork and broiler export forecasts are reduced for 2008 and 2009. Demand is expected to remain relatively weak due to economic uncertainty, and a stronger US dollar may further dampen sales.
Cattle, broiler, and turkey price forecasts for both 2008 and 2009 are lowered as demand is weaker than expected. Forecast hog prices are reduced slightly in 2008, but are unchanged for 2009 as supplies of competing meats are lowered. Egg prices are little changed.
Milk production forecasts for 2008 and 2009 are reduced slightly from last month. The cow number forecasts are unchanged. Forecast milk per cow for both years is reduced reflecting the continued slow rate of growth in output per cow. Commercial export forecasts for 2008 are raised as export data points towards stronger-than-expected sales, especially on a fat basis. However, the forecasts for 2009 are unchanged as weaker international demand is expected to limit exports. Fat basis imports for 2008 are reduced due to weaker demand but skim-solids imports are adjusted to reflect higher-thanexpected third-quarter imports. Weakness in demand for fat basis imports is expected to carry into 2009, thus the fat basis import forecast for 2009 is lowered. Sales of nonfat dry milk (NDM) to the CCC are forecast for higher 2008 and 2009.
Class III and Class IV prices for 2008 and 2009 are reduced from last month as most product price forecasts are lowered. Demand both domestically and in international markets will likely be affected by economic weakness. Although relative product values may encourage milk to shift to cheese production, butter and NDM prices will be pressured by relatively weak demand for much of the year. Cheese prices are forecast weaker as domestic demand lags in a weak economy. Although the whey price is unchanged from last month, weaker cheese prices will push the Class III price lower while lower butter and NDM prices will result in a reduced Class IV price. The 2008 all milk price forecast is unchanged this month, averaging $18.30 to $18.40 per cwt, but the 2009 forecast is lowered to $14.95 to $15.75 per cwt.
WHEAT: Projected US wheat ending stocks for 2008/09 are raised 20 million bushels this month on higher imports and lower food use. Wheat imports are projected 10 million bushels higher as abundant foreign supplies of feed quality wheat and extremely low ocean freight rates provide incentives to import wheat for domestic feeding. Wheat food use is projected 10 million bushels lower based on the latest mill-grind data from the US Bureau of Census. High flour extraction rates are limiting year-toyear growth in wheat-milling use. By-class changes to imports and exports are also made this month reflecting the pace of shipments to date. The all-wheat season-average farm price is projected 15 cents lower on both ends of the range to $6.40 to $7.00 per bushel.
Global 2008/09 wheat production is projected at 684.0 million tons, up 1.6 million from last month. Increases for Canada, Brazil, EU-27, and Serbia more than offset a reduction for Argentina. Production for Canada is raised 1.3 million tons in line with the latest estimates from Statistics Canada. Brazil production is raised 0.4 million tons based on recent government estimates that indicate higher production despite excessive rains during harvest. Production is raised 0.3 million tons for EU-27 with an increase for the United Kingdom which also experienced heavy harvest time rains that raised uncertainty about final yields.
Production is raised 0.1 million tons for Serbia. Production for Argentina is cut 0.5 million tons as harvest results indicate substantial yield variability and reductions caused by extended dryness over the past few months.
World wheat imports and exports for 2008/09 are both lowered slightly this month. Imports are lowered as the increase in US imports is more than offset by 0.2 million ton reductions for both Malaysia and Vietnam. Exports are lowered as a 0.5-million-ton increase for Canada is more than offset by 0.5 million ton reductions for both Argentina and Australia. Exports are also lowered 0.1 million tons for Malaysia as reduced imports lower flour export prospects.
World wheat consumption for 2008/09 is lowered this month mostly reflecting the reduction in U.S. wheat food use. Global wheat feeding is increased 0.3 million tons with increases for Australia and Brazil. Untimely harvest rains in eastern Australia and Brazil have reduced wheat quality in both countries. Partly offsetting is a reduction in expected wheat feed use in Vietnam with reduced imports. Global ending stocks are raised 2.1 million tons this month. Nearly two-thirds of the increase is in North America with Canada and US stocks projected 0.8 million tons and 0.5 million tons higher, respectively.
COARSE GRAINS: Projected US feed grain ending stocks for 2008/09 are raised this month with increases for corn, barley, and oats. Corn use is projected lower with increased feed and residual use more than offset by reductions in ethanol use and exports. Ethanol use is projected 300 million bushels lower this month as prospects for blending above federally mandated levels decline. Financial problems for ethanol producers are reducing plant capacity utilization for existing plants and delaying plant openings for those facilities still under construction. Falling gasoline prices have also resulted in high relative prices for ethanol, reducing blender incentives. Despite reductions in expected meat production, corn feed and residual use are raised 50 million bushels as lower ethanol production reduces the availability of distiller grains. Corn exports are projected 100 million bushels lower reflecting strong competition from larger foreign grain supplies and the slow pace of sales to date. Projected ending stocks are raised 350 million bushels. The season-average farm price is projected at $3.65 to $4.35 per bushel, down on both ends of the range from last month’s $4.00 to $4.80 per bushel.
Other US feed grain changes this month reflect reduced prospects for exports and increased prospects for imports that are only partly offset by increased domestic use. Sorghum exports are reduced 10 million bushels based on the slow pace of sales and shipments. Sorghum feeding is raised an offsetting 10 million bushels. Barley imports are raised 5 million bushels and exports reduced 5 million bushels, adding 10 million bushels to ending stocks. Oats imports are raised 5 million bushels increasing projected ending stocks the same amount. The sorghum farm price is projected lower at $3.00 to $3.60 per bushel compared with $3.40 to $4.20 per bushel last month. The projected range for the oats farm price is narrowed 10 cents on both ends to $2.80 to $3.00 per bushel. The barley farm price range is raised 15 cents on each end of the range to $4.85 to $5.45 per bushel. The all barley farm price continues to be supported by high pre-planting contract prices for 2008 malting barley.
Global coarse grain supples for 2008/09 are projected 7.3 million tons higher this month with beginning stocks raised 1.6 million tons and production raised 5.7 million tons. Beginning stocks are increased partly reflecting upward revisions to 2007/08 production for Australia and Brazil sorghum and South Africa corn. Increased 2008/09 global coarse grain output is driven by higher projected corn production for China, EU-27, Canada, and Ukraine; higher projected barley production for Canada; and higher sorghum production for countries of Sub-Saharan Africa. China corn production is raised 4 million tons based on early provincial reports. EU-27 corn production is raised 1.4 million tons based on the latest reported data. Canada corn production is raised 0.7 million tons and barley production is raised 0.6 million tons based on the latest Statistics Canada estimates. Ukraine corn production is raised 0.5 million tons in line with yield indications from the final stages of harvesting. Partly offsetting is a reduction of 1.5 million tons for Brazil corn output on early season dryness for the first crop and lower expected area for the second crop. Corn production is also lowered 1.0 million tons for South Africa reflecting reduced area as indicated by planting intentions. Oats production for Australia is lowered 0.2 million tons based on the latest government estimate.
World coarse grain imports and exports for 2008/09 are both lowered this month. Global exports are projected 2.3 million tons lower mostly reflecting this month’s reduction in US corn exports. India corn exports are also reduced 0.5 million tons. Partly offsetting are increases for Brazil, Serbia, Canada, and Russia. Global coarse grain feeding is projected up 0.3 million tons as the 1.2-million-ton increase in US corn is mostly offset by reductions in a number of countries. Global coarse grain consumption is projected 7.4 million tons lower mostly on lower expected US ethanol corn use. Global coarse grain stocks for 2008/09 are projected at 165.5 million tons, up 14.6 million from last month, and the highest since 2004/05.
RICE: Projected US rice beginning stocks and production for 2008/09 are unchanged from a month ago; however, imports are lowered 3 million cwt to 22.5 million. The reduction in the import projection is due to a slower-than-expected pace of imports early in the marketing year from key suppliers including Thailand and India, and the expectation that the pace will remain depressed the remainder of the marketing year. Long-grain imports are lowered 2 million cwt, while combined medium- and shortgrain imports are lowered 1 million. Although all rice domestic and residual use is unchanged from a month ago, the by-class projections are changed slightly with long-grain raised 1 million cwt and offset by a reduction of 1 million for combined medium- and short-grain. All rice exports are lowered 1 million cwt to 106 million, all in long-grain. Rough rice exports are raised 1 million cwt to 39 million, while combined milled- and brown-exports (on a rough-equivalent basis) are lowered 2 million cwt to 67.0 million. All rice ending stocks are projected at 23.4 million cwt, 2 million cwt below last month, with the reduction all in long-grain.
The all rice season-average farm price is forecast at $15.15 to $16.15 per cwt, up 65 cents per cwt on both ends of the range. The long-grain season-average farm price range is projected at $14.50 to $15.50 per cwt, up 65 cents per cwt on each end of the range. The combined medium- and short-grain farm price range is projected at $18.00 to $19.00 per cwt, up $1.00 per cwt on each end. Although global rice prices have trended downward since the beginning of the marketing year, they are declining at a slower-than-expected rate. Government policies in Thailand (intervention program) combined with continued export bans by India and Egypt are affecting global prices. Additionally, monthly farm prices reported by the National Agricultural Statistics Service through November (preliminary) indicate that the season-average price will be higher than projected a month ago, particularly for medium-grain rice. World 2008/09 rice supply and use are changed little from a month ago.
Global production is raised slightly because of small increases for South Korea and Uruguay. World imports are raised due to increases for Iran, Iraq, and Venezuela, which are partially offset by a reduction for the United States. Global ending stocks for 2008/09 are projected at 80.8 million tons, up slightly from last month, and 2.3 million tons above 2007/08. Stocks are raised for Iran, Iraq, Venezuela, and Uruguay; and lowered for Australia and the United States.
OILSEEDS: US oilseed production for 2008/09 is projected at 88.2 million tons, up slightly due to increased cottonseed production. Soybean exports are raised 30 million bushels to 1.05 billion bushels reflecting strong early season shipments and sales, especially to China. Soybean crush is reduced 30 million bushels to 1.715 billion, reflecting weak domestic soybean meal consumption and lower soybean meal export prospects, especially to Canada. Projected soybean ending stocks are unchanged at 205 million bushels.
Soybeans and soybean product prices for 2008/09 are projected lower this month. The US season-average soybean price range for 2008/09 is projected at $8.25 to $9.75, down $0.85 on both ends. The soybean meal price is projected at $240 to $300 per short ton, down $15 on both ends of the range. The soybean oil price range is projected at 31 to 35 cents per pound, down 6.5 cents on both ends.
Global oilseed production for 2008/09 is projected at a record 418.3 million tons, up 0.4 million tons from last month. Foreign crops account for nearly all of the change with higher estimates for rapeseed and peanuts only partly offset by lower soybean, sunflowerseed, and cottonseed production estimates. Projected soybean production for India increased 0.5 million tons from last month to a record 9.7 million. The change reflects higher yields resulting from this year’s harvest. Paraguay soybean production is reduced 0.7 million tons to 6.5 million tons due to lower planted area. Brazil soybean production is reduced 1 million tons to 59 million due to lower projected area. The reduction reflects recent government surveys that indicate area is expected to be unchanged from 2007/08. Canada rapeseed production is raised 1.7 million tons to a record 12.6 million tons based on the latest survey results from Statistics Canada. Canada’s soybean crop is also increased this month based on the survey. Argentina sunflowerseed production was reduced this month as unusually dry weather prevented producers from meeting earlier expectations. Sunflowerseed production was also reduced for India. Other changes include reduced cottonseed production for Brazil and Uzbekistan, and higher peanut production for India.
Global oilseed crush for 2007/08 is reduced 0.5 million tons this month to 348 million due mainly to lower soybean crush for Brazil, Argentina, and the United States. Partly offsetting are increases in soybean crush for India, higher rapeseed crush for Canada and China, and higher sunflowerseed crush for EU-27. Global trade changes include reduced soybean exports for Argentina, Brazil, and Paraguay; higher rapeseed exports for Canada; and higher rapeseed imports for China.
Global oilseed ending stocks for 2007/08 are raised 0.8 million tons to 65.4 million mainly reflecting higher rapeseed stocks in Canada.
SUGAR: Projected 2008/09 US sugar supply is decreased 26,000 short tons, raw value, from last month, due to revised lower beginning stocks. Imports from Mexico are raised 80,000 tons and offset by a reduction in imports under the re-export programs, while exports are lowered 80,000 tons to reflect the stronger US dollar exchange rate relative to the Mexican peso. Ending stocks are raised 54,000 tons from last month to 961,000 tons, down 703,000 tons from 2007/08.
For 2007/08, imports from Mexico are increased 159,000 tons to reflect additional information from US Customs; and with the revision in ending stocks, the residual statistical discrepancy is lowered to - 71,000 tons.
For Mexico, estimated ending stocks for 2007/08 (Oct-Sep) are lowered 172,000 metric tons from last month mainly due to the increase in exports. Production and domestic use of sugar in Mexico for 2008/09 are unchanged from last month. With the changes in US-Mexico trade, Mexico’s ending stocks for 2008/09 are lowered 322,000 tons to 1.03 million, down 355,000 tons from 2007/08.
Further Reading
| - | You can view the full report by clicking here. |
December 2008

AABNet and partners launch landmark guide on the conservation of African livestock genetic resources
3 March 2026
3
minute read
 2 March 2026
4
minute read
2 March 2026
4
minute read