


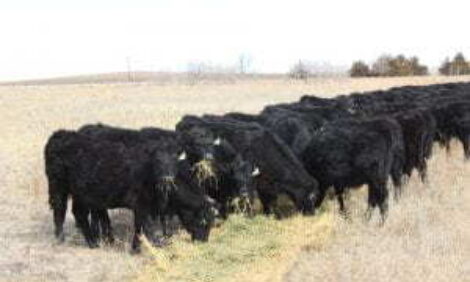
New Zealand Livestock and Products Annual Report 2008
By USDA, Foreign Agricultural Service - This article provides the cattle industry data from the USDA FAS Livestock and Products Annual 2008 report for New Zealand. A link to the full report is also provided. The full report includes all the tabular data, which we have omitted from this article. 31 August 2008
 18 minute read
Report Highlights:
New Zealand beef production in CY 2007 declined for the third consecutive year. However, as a result of an upturn in total slaughter, production is expected to increase nearly 2% in CY 2008 reaching 618,000 tons. A lower average carcass weight will temper the overall increase in production in CY 2008. New Zealand beef exports are forecast to increase 19,000 tons in CY 2008 to 515,000 tons, a 3.8% increase over CY 2007 but still 15,000 tons, or 2.8%, below CY 2006 levels.
Summary
New Zealand beef production in CY 2007 declined for the third consecutive year. However, as a result of an upturn in total slaughter, production is expected to increase nearly 2% in CY 2008 reaching 618,000 tons. New Zealand beef exports are forecast to increase 19,000 tons in CY 2008 to 515,000 tons, a 3.8% increase over CY 2007 but still 15,000 tons, or 2.8%, below CY 2006 levels.
There are several factors impacting the level of New Zealand beef production. Beef producers, who usually raise both sheep and beef in a mixed livestock system, have struggled over the past several years to achieve profitability. However, farm gate prices for both lamb and beef have increased significantly so far in 2008. As world prices are expected to remain strong and the New Zealand dollar is depreciating relative to the U.S. dollar and other major currencies, this bodes well for farm gate prices in New Zealand and has helped to restore confidence in the sector. However, producer profitability will be tempered somewhat by higher on farm costs, especially for fertilizer and fuel.
Even though beef prices are starting to increase, the price recovery will unlikely prevent a decrease in beef production in CY 2009. Total beef production is forecast to decline to 600,000 tons on the back of a lower overall kill and lower average overall carcass weights. Lower production combined with stable domestic consumption suggests that exports will likely to fall by 3.5% to 497,000 tons in CY 2009, which is similar to the export volume in CY 2007. However, as the composition of exports during CY 2009 will likely start to reflect a higher percentage of manufacturing beef, New Zealand beef exports to the United States are forecast to reverse their downward trend and increase from 235,000 CWE tons to approximately 245,000 CWE tons in CY 2009.
Dairy industry trends will continue to influence New Zealand beef production in the next few years. The growth in the dairy industry is expected to result in approximately 800,000 head of cows per year being culled. Over the long term, this means that the composition of New Zealand’s beef production will likely swing even further toward manufacturing beef. As a result, New Zealand will likely fill its U.S. quota in the future.
Recently signed free trade agreements (FTAs) are expected to enhance the competitive position of New Zealand exporters in key growth markets, particularly in Asia. New Zealand’s Prime Minister Helen Clark and Chinese Premier Wen Jiabao signed a bilateral free trade agreement (FTA) in Beijing on April 7, 2008, China’s first FTA with an OECD country. Under the agreement, China’s tariffs on beef, which currently range from 12 to 25%, will be phased out by 2016. New Zealand and Australia also recently announced an FTA with the ASEAN countries. While the terms of the agreement are not yet public, it is expected to be signed in December 2008 and will likely enhance New Zealand’s competitive position in key growth markets including Indonesia, Malaysia and the Philippines.
Production
CY 2007
Cattle slaughter fell 3.57 million head in CY 2007, down 6% from the previous year. A major factor accounting for the decline was the drought in the autumn of 2007 (Jan-May), which hit the east coasts of both the North and South Islands. Because of the drought, producers withheld underweight animals from slaughter. Another factor contributing to the lower slaughter rate was the retention of as many dairy cows as possible to take full advantage of high world prices. Taking into account these factors, as well as the 2007 livestock census conducted by Statistics New Zealand, post has revised the ending inventory estimates to 9.73 million head, which is a 1.25% increase on the opening inventory.
CY 2008
Total Slaughter up 3%
Based on actual slaughter numbers for the first six months of CY 2008, post has revised the total cattle slaughter estimate to 3.675 million head. This is a 3% increase over CY 2007. During the first six months of CY 2008, bull, heifer and steer slaughter rates were up 14.5%, 8.7%, and 12%, respectively, compared to the same period last year. These fairly significant increases were accompanied by a general decrease in average carcass weights. Major factors accounting for the higher total slaughter rate and decline in average carcass weights include a widespread drought during the January through May 2008 timeframe and the ongoing conversion away from sheep and beef farming to dairy production.
The drought affected most areas of New Zealand, except Northland and Gisborne, and resulted in a shortage of feed. As a result, farmers were faced with no other choice but to reduce stock numbers by having them slaughtered. (Generally, sheep and beef farmers don’t hold appreciable stocks of supplementary feed and it was very difficult and expensive to obtain off-farm grazing during the drought.) The ongoing conversion away from sheep and beef production to dairying, which continues to be significant, also resulted in more stock being slaughtered. Approximately 330 new dairy farms came on stream in CY 2007.
Now that the drought conditions are over and owing to the seasonal nature of the slaughter pattern, it is assumed that, during the second six months of CY 2008, adult cattle slaughter numbers will be similar to last year and that the total adult cattle slaughter, other than cows, for the whole of CY 2008 will be 6% ahead of CY 2007.
During the first six months of CY 2008, the total cow kill was up by 0.8% and posts forecasts this to continue during the remainder of the year. Reflecting this, posts forecasts the cow kill in CY 2008 to increase by 5,000 head or 0.8%. The cow kill was influenced by two major factors: the reduction in the beef cow herd from 1.2 million to 1.13 million head, which resulted in an extra 70,000 beef cows being slaughtered; and the retention of at least 65,000 dairy cows, that otherwise would have been slaughtered, by farmers eager to increase herd numbers.
By mid-August 2008, calf slaughter was nearly half way through its season and slaughter tallies are estimated to be 1.5% behind CY 2007. Post forecasts that, with another 200,000 dairy cows producing calves in CY 2008, the total calf kill will edge past that of CY 2007, but by only 7,000 head (0.5%).
Overall beef production should reach 618,000 tons, an increase of 1.8% on the previous year.
The combination of the sell down of beef cattle stocks and increased retentions in the dairy herd suggest that the total closing inventory will rise to an estimated 9.833 million head, a 1.1% increase over beginning inventories.
Profits on Sheep and Beef Farms Lowest in Two Decades
As can be seen from the graph below, profits on sheep and beef farms have plunged hitting the lowest point in two decades in 2008. This stands in stark contrast to the dairy sector. Historically high dairy prices and commensurate profits have translated into an almost unprecedented move away from sheep and beef farming to either dairy conversions, dairy support in the form of growing supplementary feed crops, or the provision of grazing for young or dry dairy stock.
CY 2009
Heifer, bull and steer slaughter rates in CY 2009 are expected to decline by 11% or 185,000 head, mainly because of lower inventories. Although the beef cow kill will likely decline as producers respond to an increase in beef prices by rebuilding their herds, this should be more than offset by an increase in culled dairy cows. The number of culled dairy cows is expected to increase because the cows retained over the last two years, which would have otherwise been killed, will have come to the end of there useful lives or won’t be in-calf again. Post forecasts the total cow kill to increase 60,000 head in CY 2009, an increase of 9% over the previous year.
Post forecasts the calf kill to increase by 100,000 head, or 7.4% in CY 2009. Factors driving the increase include the 120,000 head expansion of the dairy cow herd and lower loss figures than CY 2008. It is assumed that there will be a 10% increase in the number of male calves reared for the beef sector and that dairy farmers retain similar numbers of female calves.
Post forecasts a total slaughter of 3.65 million head in CY 2009, a 0.7% decrease from the previous year. Even though improved pasture conditions imply that carcass weights for adult cattle (other than cows) are likely to be higher than the last two years, nearly 60% of the total slaughter numbers in CY 2009 are expected to be calves and cows (with calves comprising approximately 40%). As this will have a negative effect on carcass weights, post is using an overall average carcass weight of 164.4 kgs versus the 170 kgs and 168 kgs used in CY 2007 and CY 2008, respectively. Post forecasts total beef production to be 600,000 tons in CY 2009.
Meat and Wool New Zealand, a levy funded industry association, forecasts there will be another 200 dairy farm conversions in CY 2009. Post estimates that these conversions will give rise to another 320,000 dairy animals on hand at the end CY 2009 taking the dairy inventory to 5.9 million head. The beef cattle herd is expected to decline by 123,000 to 4.13 million head because of lower retentions of young stock from the last 18 months, which will not replace the older prime animals slaughtered during CY 2009. The total closing inventory is forecast to increase by 2% over the opening inventory to 10.033 million head.
Farm Gate Prices Head North
During May to August 2008, farm gate prices for both lamb and beef increased significantly. While this is generally expected during the winter months because of sharply lower supply, the upturn is higher than normal. As world prices are expected to remain strong and the New Zealand dollar is depreciating relative to the U.S. dollar and other major currencies, this bodes well for farm gate prices in New Zealand and has helped to restore confidence in the sector. However, producer profitability will be tempered somewhat by higher on farm costs, especially for fertilizer and fuel.
Long Term Trends
Dairy industry trends will continue to influence New Zealand beef production in the next few years. The growth in the dairy industry is expected to result in approximately 800,000 cull cows per year being killed. Depending on the rate of herd expansion and the number of dairy conversions, the cow kill could jump to one million head. Over the long term, the composition of New Zealand’s beef production is likely to swing even further toward manufacturing beef.
If higher prices restore confidence in the outlook for the beef sector, more male calves from the dairy industry will be reared and retained. In the medium term (two to three years), this would likely boost the bull kill, but would have minimal impact on prime beef production, and further strengthen the trend toward manufacturing beef exports. Currently, most of the primal cuts (5-15% of the total) from bull carcasses are sold as table cuts.
Meat Company Profits Set to Improve
Dunedin based Silver Fern Farms (formerly PPCS), New Zealand’s largest meat processor is forecasting a profit turnaround of NZ $80 million from a $40 million loss in 2007 to a profit of $40 million in 2008.
AFFCO, another of New Zealand’s big four meat processors, recorded a net profit of NZ $10 million during the first half of 2008, which is a significant turnaround from a NZ $18.8 million loss for the same period the previous year.
Meat Industry Restructuring
Three years of low profits have prompted farmers, who cooperatively own New Zealand’s two largest meat companies - Alliance and Silver Fern Farms (SFF) - to call for restructuring to deliver better returns. While several options have been explored, SFF is now seeking farmer shareholder approval for PGGWrightson, New Zealand’s largest farm servicing and financing company, to purchase a 50% share in SFF. At least 75% of the existing farmer shareholders of SFF need to agree for this developme nt to take place. A vote is to be held in September 2008.
Consumption
New Zealand has a population of approximately 4.2 million. The consumption pattern for red meat is fairly stable. However, as in other markets, New Zealand consumers are feeling the effects of high food prices. Food prices rose 8.2% in the year to June, joining forces with soaring oil prices to push inflation up to 4%. According to official reports, the rise in the food price index is the highest in eighteen years. On an annual basis, grocery food was up 12.1% and, within this category; milk was up 22%., cheddar cheese 62%, butter 87% and bread 15%. Fruit and vegetables were up 9% for the year while meat, poultry and fish were up 4.4%. The food price index makes up just over 17% of the consumer price index. If food prices continue to rise, consumers are likely to trade down by increasing consumption of cheaper cuts at the expense of high quality premium cuts. New Zealand meat exporters are already reporting this sort of consumer behavior in their export markets.
Exports and Trade
CY 2007
Total exports during CY 2007 fell to 496,000 tons on a carcass weight equivalent (CWE) basis, down 6.5% from the previous year.
The United States is by far the largest market for New Zealand beef exports accounting for approximately 48% on a volume basis. However, New Zealand exports to the U.S. market have been trending downward falling 14% in CY 2007 to 238,000 tons. The decline is largely attributable to the expansion of the dairy sector (increased dairy cow retentions) and the commensurate drop in New Zealand’s cow slaughter and a gradual decline in the bull kill. The majority of New Zealand beef exported to the United States is 90% and 95% chemical lean beef, which is produced from cow and bull beef, and is mixed with trimmings in the United States for hamburger production.
CY 2008
Reflecting slaughter rates and other factors, New Zealand beef exports are forecast to recover in CY 2008 to 515,000 tons on a CWE basis, a 3.8% increase over CY 2007 but still 15,000 tons, or 2.8%, below CY 2006 levels.
While the United States continues to be by far the largest market for New Zealand beef, exports during the first six months of CY 2008 fell further - down 1,600 tons or 1.4%.
As can be seen from the table above, New Zealand beef exports to the EU27 during the first six months of CY 2008 were up significantly reaching 6,954 tons and valued at an average price of USD $11,624 per ton. This compares to just 1,958 tons during the first six months of CY 2006 with an average price of USD $7,647 per ton. New Zealand exporters are likely benefiting from gaps in the market resulting from the significant drop in EU imports of Brazilian beef due to traceability and food safety concerns.
New Zealand beef exporters are poised to benefit from the growing demand for meat in developing countries as incomes and populations continue to grow. New Zealand beef exports to Southeast Asia, a dynamic region, have ranged between 50,000 to 58,000 tons annually over the past three years, but, during the first six months of CY 2008 exports reached 43,000 tons. Indonesia, the Philippines, Hong Kong and Singapore are all important growth markets. Indonesia has become the single largest destination with an 80% increase in export volumes from CY 2005 to CY 2007. New Zealand’s competitive position in these markets could be enhanced by the recent announcement of a free trade agreement between New Zealand, Australia and the ASEAN countries. The agreement is expected to be signed in December 2008.
New Zealand beef exporters are reportedly seeing increased demand for manufacturing or lower quality table cuts as end users either attempt to trade down to limit cost increases, or in the case of the emerging growth economies of South East Asia, consume increased quantities of protein. To a certain extent, this situation is shown in the chart above. The markets that tend to consume relatively low-priced manufacturing beef are showing a consistent upward price trend.
While U.S. prices for imported 95% chemical lean (such as New Zealand bull beef ) have jumped from USD $1.30-1.40/lb a year ago to around USD $1.90/lb in August 2008, New Zealand exporters are responding to increased demand from other markets, especially for the manufacturing cuts from prime steer and heifer beef. For example, Russia, which imported anywhere between 60 to 550 tons of New Zealand manufacturing type beef cuts prior to 2008, imported 2,518 tons in just the first six months of CY 2008 at prices comparable to New Zealand’s average overall export price.
Both South Korea and Japan continue to be important markets for New Zealand exports accounting for 11.4% and 8.7% of total exports, respectively for the first six months in CY 2008. For New Zealand exporters, Japan and South Korea are quite different markets. While South Korea is reportedly a strong market for medium quality cuts, Japan tends to take relatively high-quality, high-priced cuts. While New Zealand exporters have worked to develop a stable and differentiated market for grass fed beef in both Japan and South Korea, exports will likely decline as the United States regains access.
CY 2009
Total beef production in CY 2009 is forecast to decline to 600,000 tons on the back of a lower overall kill and lower average overall carcass weights. (See Production Section for details.) Lower production combined with stable domestic consumption implies that exports are likely to fall by 3.5% from 515,000 to 497,000 tons in CY 2009, which is similar to the export volume in CY 2007. However, as the composition of exports during CY 2009 will likely start to reflect a higher percentage of manufacturing beef, New Zealand beef exports to the United States are forecast to reverse their downward trend and increase in CY 2009 from 235,000 tons to approximately 245,000 tons on a CWE basis. As New Zealand is expected to produce more manufacturing beef over the next two to three years, New Zealand is likely to again fill its U.S. quota.
Trade Policy
National Animal Identification & Tracing (NAIT) System
In June 2008 the New Zealand Government announced that, together with dairy and livestock industries, they would jointly fund and develop a national animal ID system, which is intended to provide New Zealand livestock owners, processors and government officials with timely and quality information on the current location, movement and other key attributes associated with livestock. A consultation period is currently underway as stakeholders work toward an agreement on the shape and form of the NAIT system.
New Zealand Beef Exports to Malaysia
There are only two meat processing plants in New Zealand that are currently licensed to export beef to Malaysia. In the past, Malaysia was a significant export market for New Zealand beef with exports reaching a peak of 7,738 tons in 2004. However, most export plants lost their export licenses in 2007 because of differences in interpretation over Halal slaughter protocols. There have been no further audits to license plants because authorities in Malaysia and New Zealand cannot agree on a licensing protocol.
Indonesia Places Temporary Ban
During early July 2008, Indonesian authorities placed a ban on New Zealand beef imports. Ostensibly, it was because Halal rules were not being followed correctly with regard to labeling. Following a meeting between New Zealand Trade Minister Phil Goff and Indonesian trade officials, the ban was lifted in mid-July 2008.
Endosulfan Scare in Beef Exported to South Korea
During early July 2008, the Food Safety Authority in South Korea complained to the New Zealand Food Safety Authority (NZFSA) regarding a supposed endosulfan contamination of New Zealand beef shipped into South Korea. An investigation was carried out by NZFSA using the trace-back procedures that are in place and tests were carried out in New Zealand. NZFSA could not find the source and tests came back negative.
E-Coli Testing for Exports to US
At the beginning of 2008, NZFSA concluded negotiations with FSIS over E-coli testing requirements for beef exports to the U.S. market. New Zealand meat plants are using the same testing methodology as in the United States and meat plants actually exporting to the U.S. will test on a daily basis. In addition, each container load of beef will be recognized as a unique lot. This will minimize the disruption and cost to the trade in the unlikely event of a recall.
New Zealand Signs FTA with China
New Zealand’s Prime Minister Helen Clark and Chinese Premier Wen Jiabao signed a bilateral free trade agreement (FTA) in Beijing on April 7, 2008, China’s first FTA with an OECD country. The FTA is comprehensive covering goods, services and investment, and provides for a fairly rapid phase-out of tariffs for 96% of New Zealand’s exports to China. On full implementation, this will equate to an annual duty savings of NZ $115.5 million (US $82.4 million). On entry into force, duties on products that currently face tariffs of 5% or less will be eliminated. By 2012, duties in the range of 6-20% will be phased out and, by 2013; duties greater than 20% will be phased out. Remaining tariffs, including those assessed on “sensitive” agriculture products, will be phased out by January 1, 2019.
Further Reading
| - | You can view the full report by clicking here. |
List of Articles in this series
To view our complete list of Livestock and Products Annual, and Semi-Annual reports, please click hereSeptember 2008

AABNet and partners launch landmark guide on the conservation of African livestock genetic resources
3 March 2026
3
minute read
 2 March 2026
4
minute read
2 March 2026
4
minute read